
Seller's Agent in 2013
Kenneth Garcia
Rise Realty
(714) 679-6964
6 Total Sales
Estimated Value: $522,248 - $588,000
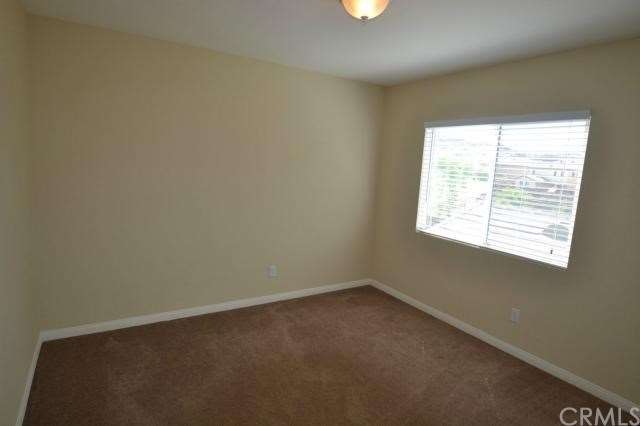
This home is located at 34120 Ogrady Ct, Beaumont, CA 92223 since 21 May 2013 and is currently priced at $548,312. This property was built in 2009. 34120 Ogrady Ct is a home located in Riverside County with nearby schools including Summerwind Trails and Beaumont Senior High School.
Last Agent to Rent the Property
VAN ESTATES, INC License #01133214 Listed on: 05/21/2013
| Date | Buyer | Sale Price | Title Company |
|---|---|---|---|
| 2018 3 Ih Borrower Lp | -- | Os Naional Llc | |
| Ih2 Property West Lp | $238,000 | Chicago Title Company | |
| Liu | -- | Chicago Title Company | |
| Hui Liu | $189,479 | None Available | |
| Dunphy Randall S | $265,500 | North American Title Company | |
| Lennar Homes Of California Inc | -- | North American Title Company |
| Date | Status | Borrower | Loan Amount |
|---|---|---|---|
| Previous Owner | Dunphy Randall S | $265,400 |
| Date | Event | Price | List to Sale | Price per Sq Ft | Prior Sale |
|---|---|---|---|---|---|
| 07/15/2013 07/15/13 | Rented | $1,795 | -6.8% | -- | |
| 07/15/2013 07/15/13 | Under Contract | -- | -- | -- | |
| 05/21/2013 05/21/13 | For Rent | $1,925 | 0.0% | -- | |
| 04/18/2013 04/18/13 | Sold | $238,000 | -0.8% | $95 / Sq Ft | View Prior Sale |
| 03/26/2013 03/26/13 | Pending | -- | -- | -- | |
| 03/21/2013 03/21/13 | For Sale | $239,900 | -- | $96 / Sq Ft |
| Year | Tax Paid | Tax Assessment Tax Assessment Total Assessment is a certain percentage of the fair market value that is determined by local assessors to be the total taxable value of land and additions on the property. | Land | Improvement |
|---|---|---|---|---|
| 2025 | $6,577 | $324,957 | $58,026 | $266,931 |
| 2023 | $6,577 | $312,341 | $55,774 | $256,567 |
| 2022 | $6,502 | $306,218 | $54,681 | $251,537 |
| 2021 | $6,460 | $300,214 | $53,609 | $246,605 |
| 2020 | $6,539 | $297,137 | $53,060 | $244,077 |
| 2019 | $6,499 | $291,312 | $52,020 | $239,292 |
| 2018 | $6,539 | $285,600 | $51,000 | $234,600 |
| 2017 | $6,310 | $252,523 | $53,049 | $199,474 |
| 2016 | $6,582 | $247,572 | $52,009 | $195,563 |
| 2015 | $6,466 | $243,855 | $51,229 | $192,626 |
| 2014 | $6,410 | $239,080 | $50,227 | $188,853 |
Seller's Agent in 2013
Kenneth Garcia
Rise Realty
(714) 679-6964
6 Total Sales
J
Landlord's Agent in 2013
Jeff Van Es
VAN ESTATES, INC
(909) 725-0475
8 Total Sales
Buyer's Agent in 2013
MENDL PAYNE
REAL BROKER
(909) 980-6281
44 Total Sales
Source: California Regional Multiple Listing Service (CRMLS)
MLS Number: IV13094451
APN: 413-710-001
Disclaimer: Certain information contained herein is derived from information provided by parties other than Homes.com. All information provided is deemed reliable, but is not guaranteed to be accurate and should be independently verified.
![]() The multiple listing data appearing on this website, or contained in reports produced therefrom, is owned and copyrighted by California Regional Multiple Listing Service, Inc. ("CRMLS") and is protected by all applicable copyright laws. Information provided is for viewer's personal, non-commercial use and may not be used for any purpose other than to identify prospective properties the viewer may be interested in purchasing. All listing data, including but not limited to square footage and lot size is believed to be accurate, but the listing Agent, listing Broker and CRMLS and its affiliates do not warrant or guarantee such accuracy. The viewer should independently verify the listed data prior to making any decisions based on such information by personal inspection and/or contacting a real estate professional.
The multiple listing data appearing on this website, or contained in reports produced therefrom, is owned and copyrighted by California Regional Multiple Listing Service, Inc. ("CRMLS") and is protected by all applicable copyright laws. Information provided is for viewer's personal, non-commercial use and may not be used for any purpose other than to identify prospective properties the viewer may be interested in purchasing. All listing data, including but not limited to square footage and lot size is believed to be accurate, but the listing Agent, listing Broker and CRMLS and its affiliates do not warrant or guarantee such accuracy. The viewer should independently verify the listed data prior to making any decisions based on such information by personal inspection and/or contacting a real estate professional.
Based on information from California Regional Multiple Listing Service, Inc. and /or other sources. All data, including all measurements and calculations of area, is obtained from various sources and has not been, and will not be, verified by broker or MLS. All information should be independently reviewed and verified for accuracy. Properties may or may not be listed by the office/agent presenting the information
Ask me questions while you tour the home.