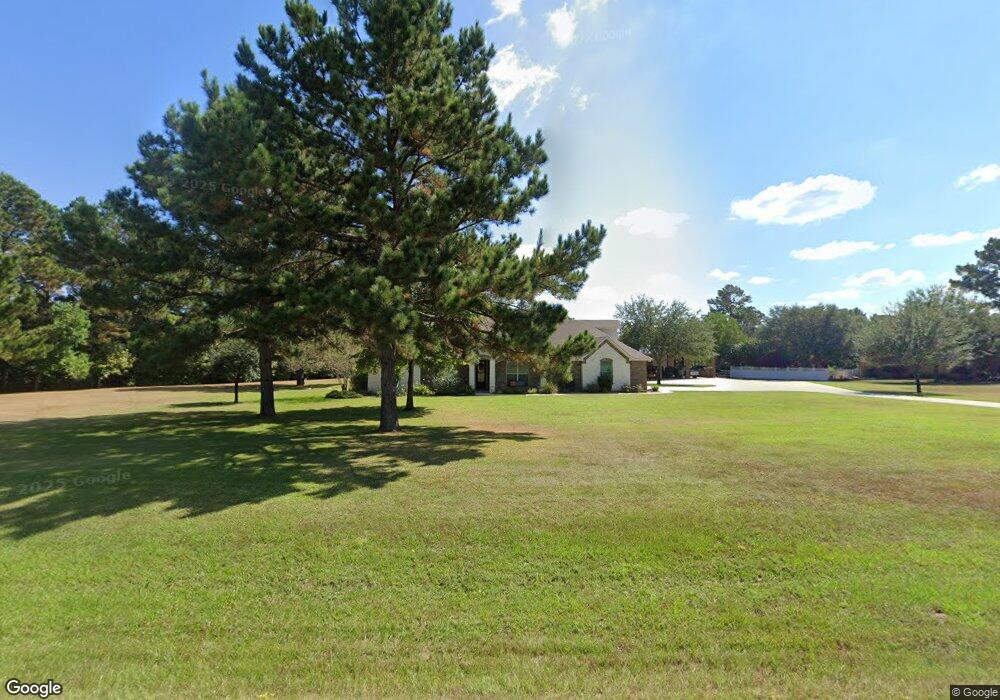
34127 Bar r Blvd Magnolia, TX 77355
Estimated Value: $712,600 - $832,000
--
Bed
1
Bath
3,188
Sq Ft
$239/Sq Ft
Est. Value
About This Home
This home is located at 34127 Bar r Blvd, Magnolia, TX 77355 and is currently estimated at $762,900, approximately $239 per square foot. 34127 Bar r Blvd is a home located in Montgomery County with nearby schools including Willie E. Williams Elementary School, Magnolia Sixth Grade Campus, and Magnolia Junior High School.
Ownership History
Date
Name
Owned For
Owner Type
Purchase Details
Closed on
Apr 22, 2010
Sold by
Brown Edward M and Brown Julie C
Bought by
Burk Claude Allen and Burk Debbie D
Current Estimated Value
Purchase Details
Closed on
Apr 21, 2010
Sold by
Brown Edward M and Brown Julie C
Bought by
Burk Claude Allen and Burk Debbie D
Purchase Details
Closed on
Jul 24, 2006
Sold by
Mader Sandra Susan
Bought by
Burk Claude Allen and Burk Debbie
Purchase Details
Closed on
Jun 13, 2002
Sold by
Clear Springs Development Company Ltd
Bought by
Burk Claude Allen and Burk Debbie
Home Financials for this Owner
Home Financials are based on the most recent Mortgage that was taken out on this home.
Original Mortgage
$19,500
Interest Rate
6.82%
Create a Home Valuation Report for This Property
The Home Valuation Report is an in-depth analysis detailing your home's value as well as a comparison with similar homes in the area
Home Values in the Area
Average Home Value in this Area
Purchase History
| Date | Buyer | Sale Price | Title Company |
|---|---|---|---|
| Burk Claude Allen | -- | Alamo Title Company | |
| Burk Claude Allen | -- | Alamo Title Company | |
| Burk Claude Allen | -- | -- | |
| Cooper Gloria Lundin | -- | Stewart Title Houston Div | |
| Burk Claude Allen | -- | -- | |
| Mader Sandra Susan | -- | Southland Title |
Source: Public Records
Mortgage History
| Date | Status | Borrower | Loan Amount |
|---|---|---|---|
| Previous Owner | Mader Sandra Susan | $19,500 |
Source: Public Records
Tax History Compared to Growth
Tax History
| Year | Tax Paid | Tax Assessment Tax Assessment Total Assessment is a certain percentage of the fair market value that is determined by local assessors to be the total taxable value of land and additions on the property. | Land | Improvement |
|---|---|---|---|---|
| 2025 | $8,314 | $626,091 | $120,258 | $505,833 |
| 2024 | $7,452 | $622,908 | -- | -- |
| 2023 | $7,452 | $566,280 | $120,260 | $503,740 |
| 2022 | $9,084 | $514,800 | $120,260 | $494,740 |
| 2021 | $8,699 | $468,000 | $89,080 | $378,920 |
| 2020 | $9,005 | $445,000 | $89,080 | $355,920 |
| 2019 | $8,821 | $438,000 | $89,080 | $348,920 |
| 2018 | $10,738 | $552,060 | $44,540 | $532,460 |
| 2017 | $10,642 | $501,870 | $44,540 | $457,330 |
| 2016 | $9,675 | $456,280 | $44,540 | $411,740 |
| 2015 | $8,083 | $416,340 | $44,540 | $371,800 |
| 2014 | $8,083 | $386,820 | $44,540 | $342,280 |
Source: Public Records
Map
Nearby Homes
- 21210 Natalia Grove
- 34010 Bar r Blvd
- 21414 Flora Springs Ln
- 21410 Flora Springs Ln
- 21235 Natalia Grove
- 19209 Olive Heath Ln
- Hanford Plan at Emory Glen
- Davenport Plan at Emory Glen
- Fordham Plan at Emory Glen
- Kingston Plan at Emory Glen
- Surrey Plan at Emory Glen
- Brent Plan at Emory Glen
- Redford Plan at Emory Glen
- Middleton Plan at Emory Glen
- Yorktown Plan at Emory Glen
- Grafton Plan at Emory Glen
- Kent Plan at Emory Glen
- Plan Douglas at Emory Glen
- Denton Plan at Emory Glen
- Newport Plan at Emory Glen
- 34127 Bar r Blvd
- 34143 Bar r Blvd
- 34111 Bar r Blvd
- 34151 Bar r Blvd
- 34035 Bar r Blvd
- 34134 Bar r Blvd
- 34118 Bar r Blvd
- 34110 Bar r Blvd
- 34142 Bar r Blvd
- 32003 Park Meadow Pass
- 34027 Bar r Blvd
- 34159 Bar r Blvd
- 34011 Bar r Blvd
- 32002 Park Meadow Pass
- 32011 Park Meadow Pass
- 34167 Bar r Blvd
- 34026 Bar r Blvd
- 34003 Bar r Blvd
- 32010 Park Meadow Pass
- 34018 Bar r Blvd