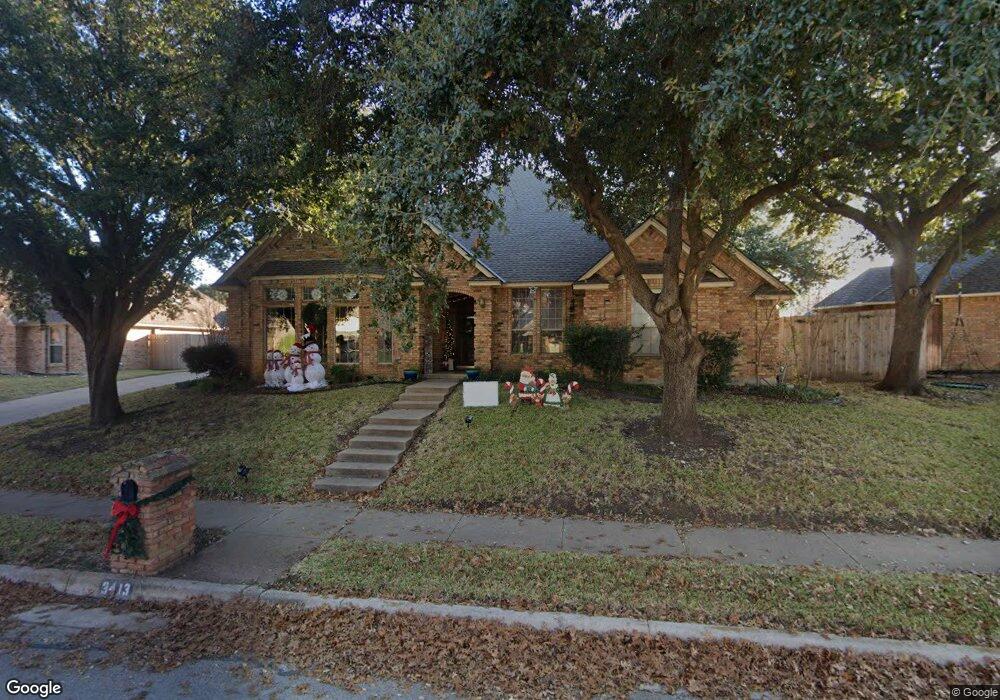
3413 Channing Ln Bedford, TX 76021
Estimated Value: $604,000 - $649,000
4
Beds
3
Baths
2,754
Sq Ft
$226/Sq Ft
Est. Value
About This Home
This home is located at 3413 Channing Ln, Bedford, TX 76021 and is currently estimated at $622,048, approximately $225 per square foot. 3413 Channing Ln is a home located in Tarrant County with nearby schools including Bedford Heights Elementary School, Bedford Junior High School, and L.D. Bell High School.
Ownership History
Date
Name
Owned For
Owner Type
Purchase Details
Closed on
May 15, 2013
Sold by
Ricci Mona Kay
Bought by
Davis Eric and Davis Nicole
Current Estimated Value
Home Financials for this Owner
Home Financials are based on the most recent Mortgage that was taken out on this home.
Original Mortgage
$196,800
Outstanding Balance
$139,954
Interest Rate
3.56%
Mortgage Type
New Conventional
Estimated Equity
$482,094
Purchase Details
Closed on
Nov 7, 2000
Sold by
Ricci David Lee
Bought by
Ricci Mona Kay
Purchase Details
Closed on
Dec 9, 1993
Sold by
Chodola Randall R and Chodola Rosemary A
Bought by
Ricci David Lee and Ricci Mona Kay
Home Financials for this Owner
Home Financials are based on the most recent Mortgage that was taken out on this home.
Original Mortgage
$185,300
Interest Rate
7.19%
Create a Home Valuation Report for This Property
The Home Valuation Report is an in-depth analysis detailing your home's value as well as a comparison with similar homes in the area
Home Values in the Area
Average Home Value in this Area
Purchase History
| Date | Buyer | Sale Price | Title Company |
|---|---|---|---|
| Davis Eric | -- | None Available | |
| Ricci Mona Kay | -- | None Available | |
| Ricci David Lee | -- | Lawyers American Title Co |
Source: Public Records
Mortgage History
| Date | Status | Borrower | Loan Amount |
|---|---|---|---|
| Open | Davis Eric | $196,800 | |
| Previous Owner | Ricci David Lee | $185,300 |
Source: Public Records
Tax History Compared to Growth
Tax History
| Year | Tax Paid | Tax Assessment Tax Assessment Total Assessment is a certain percentage of the fair market value that is determined by local assessors to be the total taxable value of land and additions on the property. | Land | Improvement |
|---|---|---|---|---|
| 2025 | $9,259 | $589,873 | $130,000 | $459,873 |
| 2024 | $9,259 | $589,873 | $130,000 | $459,873 |
| 2023 | $10,448 | $615,734 | $80,000 | $535,734 |
| 2022 | $11,139 | $510,000 | $80,000 | $430,000 |
| 2021 | $10,605 | $450,209 | $80,000 | $370,209 |
| 2020 | $9,547 | $401,529 | $80,000 | $321,529 |
| 2019 | $9,812 | $403,884 | $80,000 | $323,884 |
| 2018 | $8,858 | $364,630 | $80,000 | $284,630 |
| 2017 | $7,455 | $308,157 | $30,000 | $278,157 |
| 2016 | $6,661 | $275,346 | $30,000 | $245,346 |
| 2015 | $7,077 | $281,800 | $30,000 | $251,800 |
| 2014 | $7,077 | $281,800 | $30,000 | $251,800 |
Source: Public Records
Map
Nearby Homes
- 1209 Hillandale Ct
- 3301 Wendover Ct
- 1136 Wingate Dr
- 1109 Simpson Terrace
- 1800 Hampton Dr
- 3827 Ashbury Ln
- 1636 Bedford Oaks Dr
- 1704 Indian Oaks Ct
- 1820 Wimbleton Dr
- 1401 Danielle Dr
- 3624 Wayne Ct
- 3609 Wayne Ct
- 913 Kensington Ct
- 2901 Miles Way
- 3907 Copperwood Ct
- 1303 Crest Dr
- 3513 Meadowside Dr
- 3532 Meadowside Dr
- 4002 Copperwood Ct
- 1421 Plantation Dr N
- 3417 Channing Ln
- 3409 Channing Ln
- 1305 Cummings Dr
- 1301 Cummings Dr
- 3421 Channing Ln
- 3412 Channing Ln
- 3416 Channing Ln
- 3405 Channing Ln
- 3408 Channing Ln
- 1309 Cummings Dr
- 3420 Channing Ln
- 3424 Channing Ln
- 3404 Channing Ln
- 3428 Channing Ln
- 3401 Channing Ln
- 3313 Channing Ln
- 1304 Spargercrest Dr
- 1308 Spargercrest Dr
- 3240 Creighton Ln
- 1300 Spargercrest Dr