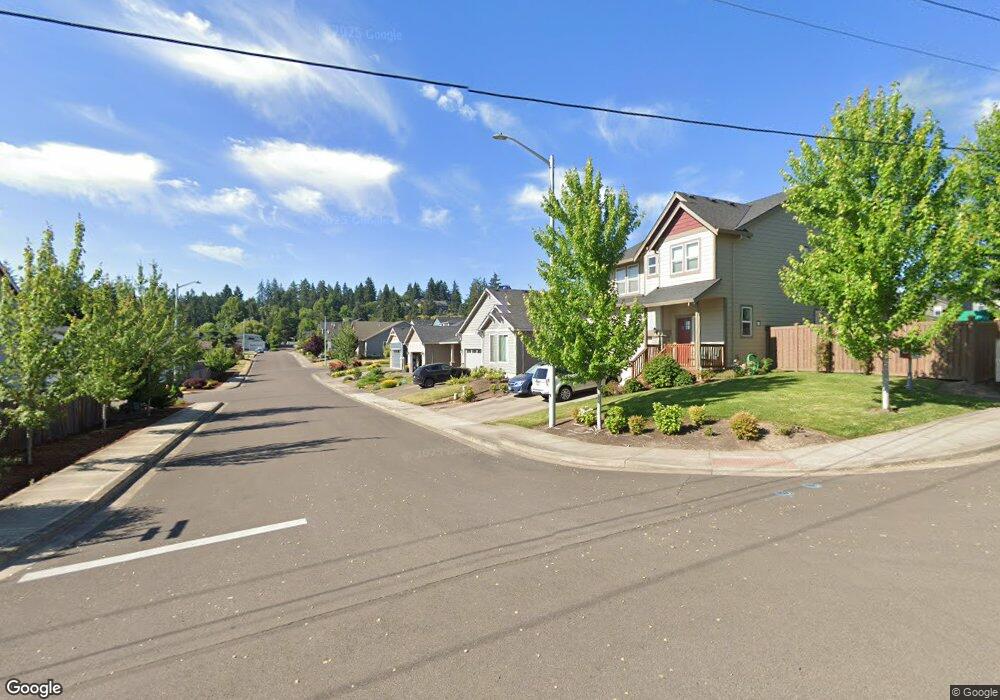
3413 Darrin St NW Salem, OR 97304
West Salem NeighborhoodEstimated Value: $507,000 - $578,000
3
Beds
2
Baths
1,770
Sq Ft
$307/Sq Ft
Est. Value
About This Home
This home is located at 3413 Darrin St NW, Salem, OR 97304 and is currently estimated at $543,075, approximately $306 per square foot. 3413 Darrin St NW is a home with nearby schools including Brush College Elementary School, Straub Middle School, and West Salem High School.
Ownership History
Date
Name
Owned For
Owner Type
Purchase Details
Closed on
Aug 31, 2020
Sold by
Ray Dylan M and Ray Taylor M
Bought by
Ray Dylan M and Ray Taylor M
Current Estimated Value
Home Financials for this Owner
Home Financials are based on the most recent Mortgage that was taken out on this home.
Original Mortgage
$266,500
Outstanding Balance
$235,872
Interest Rate
3%
Mortgage Type
New Conventional
Estimated Equity
$307,203
Purchase Details
Closed on
Dec 7, 2017
Sold by
Chira Construction Inc
Bought by
Ray Dylan M and Cooksy Taylor M
Home Financials for this Owner
Home Financials are based on the most recent Mortgage that was taken out on this home.
Original Mortgage
$279,120
Interest Rate
3.94%
Mortgage Type
New Conventional
Purchase Details
Closed on
Nov 14, 2017
Sold by
Cira Construction Inc
Bought by
Ray Dylan M and Cooksy Taylor M
Home Financials for this Owner
Home Financials are based on the most recent Mortgage that was taken out on this home.
Original Mortgage
$279,120
Interest Rate
3.94%
Mortgage Type
New Conventional
Purchase Details
Closed on
Jul 15, 2016
Sold by
Lcs Bella Rosa Llc
Bought by
Chira Construction Inc
Home Financials for this Owner
Home Financials are based on the most recent Mortgage that was taken out on this home.
Original Mortgage
$265,100
Interest Rate
3.95%
Mortgage Type
Credit Line Revolving
Create a Home Valuation Report for This Property
The Home Valuation Report is an in-depth analysis detailing your home's value as well as a comparison with similar homes in the area
Home Values in the Area
Average Home Value in this Area
Purchase History
| Date | Buyer | Sale Price | Title Company |
|---|---|---|---|
| Ray Dylan M | -- | First American | |
| Ray Dylan M | -- | First American Title | |
| Ray Dylan M | $348,900 | None Available | |
| Chira Construction Inc | $80,000 | First American |
Source: Public Records
Mortgage History
| Date | Status | Borrower | Loan Amount |
|---|---|---|---|
| Open | Ray Dylan M | $266,500 | |
| Closed | Ray Dylan M | $279,120 | |
| Closed | Ray Dylan M | $279,120 | |
| Previous Owner | Chira Construction Inc | $265,100 |
Source: Public Records
Tax History Compared to Growth
Tax History
| Year | Tax Paid | Tax Assessment Tax Assessment Total Assessment is a certain percentage of the fair market value that is determined by local assessors to be the total taxable value of land and additions on the property. | Land | Improvement |
|---|---|---|---|---|
| 2025 | $4,900 | $267,830 | $60,740 | $207,090 |
| 2024 | $4,900 | $260,030 | $58,970 | $201,060 |
| 2023 | $4,758 | $252,460 | $57,250 | $195,210 |
| 2022 | $4,606 | $245,110 | $55,590 | $189,520 |
| 2021 | $4,474 | $237,980 | $53,970 | $184,010 |
| 2020 | $4,342 | $231,050 | $52,400 | $178,650 |
| 2019 | $4,190 | $224,330 | $50,870 | $173,460 |
| 2018 | $4,121 | $217,800 | $49,380 | $168,420 |
| 2017 | $805 | $45,830 | $45,830 | $0 |
| 2016 | $786 | $44,500 | $44,500 | $0 |
Source: Public Records
Map
Nearby Homes
- 3392 Lake Vanessa Cir NW
- 3299 Oakcrest Dr NW
- 3318 Oakcrest Dr NW
- 1882 Woodstock Cir NW
- 3158 19th Place NW
- 3235 Oakcrest Dr NW
- 2230 Emmett Dr NW
- 2644 Andrew Ave NW
- 1624 Sunrise Cir NW
- 3047 Wallace Rd NW
- 1639 Nut Tree Dr NW
- 1694 Sunrise Cir NW
- 2822 Zelkova Ct NW
- 3262 Winslow Way NW
- 3096 Anastasia St NW
- 2754 Inna Ave NW
- 3074 Oakcrest Dr NW
- 3362 Elder St NW
- 3016 Twin Oak Place NW
- 2959 Vick Ave NW
- 3413 Darrin St NW
- 3401 Darrin St
- 3401 Darrin St NW
- 3421 Darrin St NW
- 3421 Darrin St
- 3397 Darrin St
- 3397 Darrin St NW
- 2185 Darrin Ct NW
- 000 Darrin St NW
- 2169 Darrin Ct
- 2169 Darrin Ct NW
- 0 Darrin (Lot #25) St SE
- 2375 Michigan City Ln NW
- 2170 Darrin Ct NW
- 2170 Darrin Ct NW
- 2170 Darrin Ct NW
- 2182 Darrin Ct NW
- 3389 Darrin St NW
- 3389 Darrin St
- 2133 Darrin Ct NW