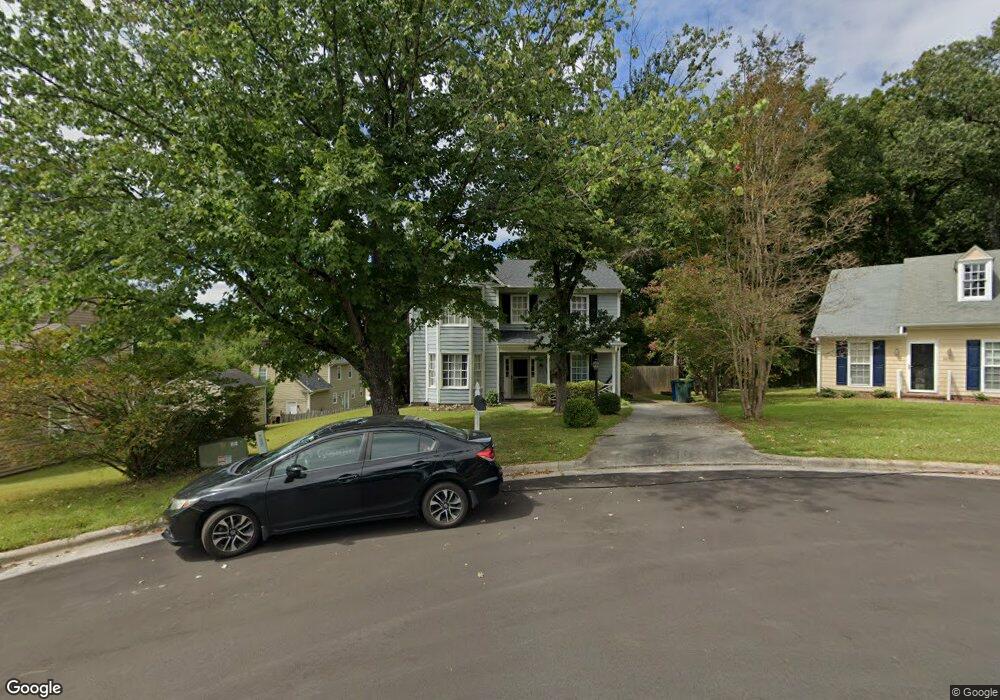
3413 Kerrigan Ct Durham, NC 27703
Eastern Durham NeighborhoodEstimated Value: $350,394 - $384,000
3
Beds
3
Baths
2,012
Sq Ft
$183/Sq Ft
Est. Value
About This Home
This home is located at 3413 Kerrigan Ct, Durham, NC 27703 and is currently estimated at $368,099, approximately $182 per square foot. 3413 Kerrigan Ct is a home located in Durham County with nearby schools including Merrick-Moore Elementary School, John W Neal Middle School, and Southern School of Energy & Sustainability.
Ownership History
Date
Name
Owned For
Owner Type
Purchase Details
Closed on
Jun 23, 2016
Sold by
Allied Investors Grp Llc
Bought by
Chavez Emily Susanna
Current Estimated Value
Home Financials for this Owner
Home Financials are based on the most recent Mortgage that was taken out on this home.
Original Mortgage
$182,000
Outstanding Balance
$147,976
Interest Rate
4.25%
Estimated Equity
$220,123
Purchase Details
Closed on
Feb 22, 2016
Sold by
Mitchell Paul
Bought by
Allied Investors Grp Llc
Home Financials for this Owner
Home Financials are based on the most recent Mortgage that was taken out on this home.
Original Mortgage
$71,500
Interest Rate
3.81%
Purchase Details
Closed on
Aug 1, 2009
Sold by
Mitchell Paul Charles
Bought by
Mitchell Paul Charles and Thomas Paula
Purchase Details
Closed on
Feb 27, 2008
Sold by
Hud
Bought by
Mitchell Paul Charles
Home Financials for this Owner
Home Financials are based on the most recent Mortgage that was taken out on this home.
Original Mortgage
$122,550
Interest Rate
5.46%
Purchase Details
Closed on
Jun 15, 2007
Sold by
Chase Home Finance Llc
Bought by
Hud
Purchase Details
Closed on
Apr 16, 2007
Sold by
Hardison Helen M and Hardison Sheldren L
Bought by
Chase Home Finance Llc
Create a Home Valuation Report for This Property
The Home Valuation Report is an in-depth analysis detailing your home's value as well as a comparison with similar homes in the area
Home Values in the Area
Average Home Value in this Area
Purchase History
| Date | Buyer | Sale Price | Title Company |
|---|---|---|---|
| Chavez Emily Susanna | $182,000 | -- | |
| Allied Investors Grp Llc | $110,500 | -- | |
| Mitchell Paul Charles | -- | None Available | |
| Mitchell Paul Charles | -- | None Available | |
| Hud | -- | None Available | |
| Chase Home Finance Llc | $152,067 | None Available |
Source: Public Records
Mortgage History
| Date | Status | Borrower | Loan Amount |
|---|---|---|---|
| Open | Chavez Emily Susanna | $182,000 | |
| Previous Owner | Allied Investors Grp Llc | $71,500 | |
| Previous Owner | Mitchell Paul Charles | $122,550 |
Source: Public Records
Tax History Compared to Growth
Tax History
| Year | Tax Paid | Tax Assessment Tax Assessment Total Assessment is a certain percentage of the fair market value that is determined by local assessors to be the total taxable value of land and additions on the property. | Land | Improvement |
|---|---|---|---|---|
| 2025 | $3,119 | $314,661 | $80,600 | $234,061 |
| 2024 | $2,571 | $184,349 | $24,840 | $159,509 |
| 2023 | $2,415 | $184,349 | $24,840 | $159,509 |
| 2022 | $2,359 | $184,349 | $24,840 | $159,509 |
| 2021 | $2,348 | $184,349 | $24,840 | $159,509 |
| 2020 | $2,293 | $184,349 | $24,840 | $159,509 |
| 2019 | $2,293 | $184,349 | $24,840 | $159,509 |
| 2018 | $2,143 | $158,013 | $24,840 | $133,173 |
| 2017 | $2,128 | $158,013 | $24,840 | $133,173 |
| 2016 | $2,056 | $158,013 | $24,840 | $133,173 |
| 2015 | $2,247 | $162,330 | $26,620 | $135,710 |
| 2014 | $2,247 | $162,330 | $26,620 | $135,710 |
Source: Public Records
Map
Nearby Homes
- 10 Petersburg Place
- 9 Petersburg Place
- 6 Fircrest Ct
- 0 Seford Dr
- 912 Obsidian Way
- 903 Outlaw Ave Unit Homesite 21
- 916 Clayton Rd
- 3602 Turquoise Dr
- 2018 Cross Bones Blvd
- 2018 Cross Bones Blvd Unit 28
- 1011 Homecoming Way
- 1101 Shovelhead Dr Unit 51
- 607 Chopper Ln Unit Homesite 9
- 3615 Freeman Rd
- 322+326 Chandler Rd
- 1007 Shovelhead Dr Unit 4
- Beramont Plan at Chandler Run
- Merlot Plan at Chandler Run
- Millhaven Plan at Chandler Run
- 1008 Shovelhead Dr Unit 55
- 3415 Kerrigan Ct
- 3403 Woodland Park Rd
- 3403 Woodland Park Rd
- 3411 Kerrigan Ct
- 3333 Woodland Park Rd
- 3416 Kerrigan Ct
- 3331 Woodland Park Rd
- 3415 Woodland Park Rd
- 3414 Kerrigan Ct
- 3323 Woodland Park Rd
- 3400 Woodland Park Rd
- 3406 Woodland Park Rd
- 3408 Woodland Park Rd
- 3319 Woodland Park Rd
- 3332 Reams Place
- 3332 Reams Ct
- 3419 Woodland Park Rd
- 3414 Woodland Park Rd
- 3317 Woodland Park Rd
- 3324 Woodland Park Rd