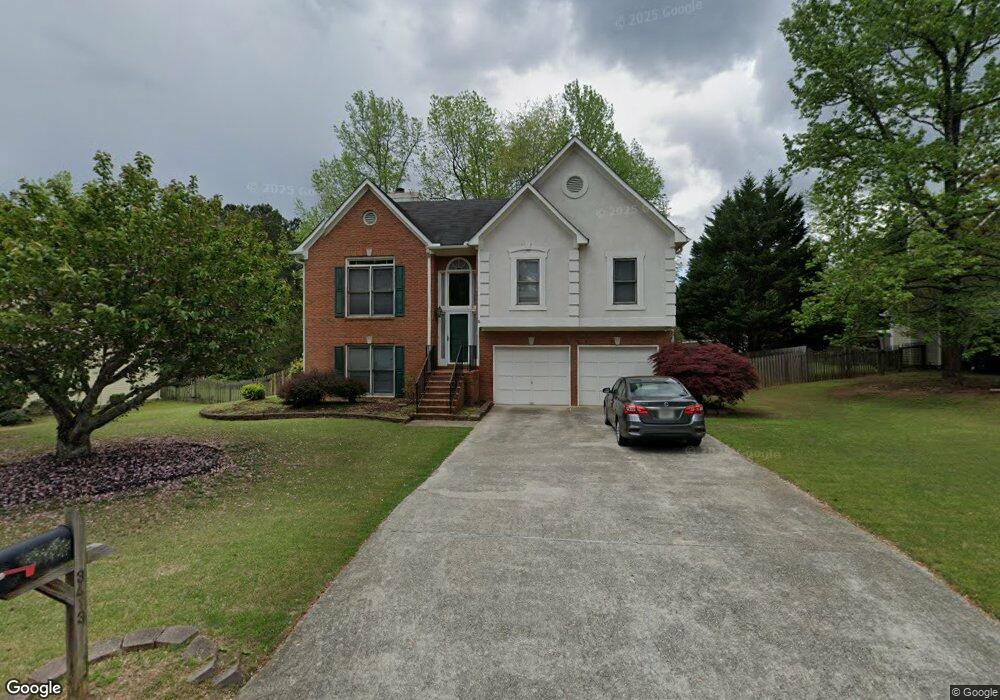
3413 N Cook Rd Unit 3 Powder Springs, GA 30127
West Cobb NeighborhoodEstimated Value: $364,984 - $423,000
4
Beds
3
Baths
1,557
Sq Ft
$254/Sq Ft
Est. Value
About This Home
This home is located at 3413 N Cook Rd Unit 3, Powder Springs, GA 30127 and is currently estimated at $395,996, approximately $254 per square foot. 3413 N Cook Rd Unit 3 is a home located in Cobb County with nearby schools including Still Elementary School, Lovinggood Middle School, and Hillgrove High School.
Ownership History
Date
Name
Owned For
Owner Type
Purchase Details
Closed on
Mar 21, 2005
Sold by
Hinman Dennis R and Hinman Lois
Bought by
Feyerabend Thomas M and Feyerabend Paula
Current Estimated Value
Home Financials for this Owner
Home Financials are based on the most recent Mortgage that was taken out on this home.
Original Mortgage
$153,520
Outstanding Balance
$76,951
Interest Rate
5.54%
Mortgage Type
New Conventional
Estimated Equity
$319,045
Purchase Details
Closed on
Apr 21, 1997
Sold by
Tony Landress
Bought by
Hinman Dennis R and Hinman Lois A
Home Financials for this Owner
Home Financials are based on the most recent Mortgage that was taken out on this home.
Original Mortgage
$141,900
Interest Rate
7.95%
Mortgage Type
VA
Purchase Details
Closed on
Dec 23, 1994
Sold by
Diversified Dev Inc
Bought by
Landress Tony
Home Financials for this Owner
Home Financials are based on the most recent Mortgage that was taken out on this home.
Original Mortgage
$60,000
Interest Rate
5.62%
Create a Home Valuation Report for This Property
The Home Valuation Report is an in-depth analysis detailing your home's value as well as a comparison with similar homes in the area
Home Values in the Area
Average Home Value in this Area
Purchase History
| Date | Buyer | Sale Price | Title Company |
|---|---|---|---|
| Feyerabend Thomas M | $191,900 | -- | |
| Hinman Dennis R | $141,900 | -- | |
| Landress Tony | $135,900 | -- |
Source: Public Records
Mortgage History
| Date | Status | Borrower | Loan Amount |
|---|---|---|---|
| Open | Feyerabend Thomas M | $153,520 | |
| Previous Owner | Hinman Dennis R | $141,900 | |
| Previous Owner | Landress Tony | $60,000 |
Source: Public Records
Tax History Compared to Growth
Tax History
| Year | Tax Paid | Tax Assessment Tax Assessment Total Assessment is a certain percentage of the fair market value that is determined by local assessors to be the total taxable value of land and additions on the property. | Land | Improvement |
|---|---|---|---|---|
| 2025 | $946 | $139,148 | $16,000 | $123,148 |
| 2024 | $949 | $139,148 | $16,000 | $123,148 |
| 2023 | $2,821 | $139,148 | $16,000 | $123,148 |
| 2022 | $2,589 | $102,588 | $16,000 | $86,588 |
| 2021 | $2,589 | $102,588 | $16,000 | $86,588 |
| 2020 | $2,369 | $92,544 | $10,000 | $82,544 |
| 2019 | $2,067 | $78,736 | $10,000 | $68,736 |
| 2018 | $2,067 | $78,736 | $10,000 | $68,736 |
| 2017 | $1,827 | $72,484 | $10,000 | $62,484 |
| 2016 | $1,828 | $72,484 | $10,000 | $62,484 |
| 2015 | $1,631 | $64,208 | $10,000 | $54,208 |
| 2014 | $1,429 | $56,924 | $0 | $0 |
Source: Public Records
Map
Nearby Homes
- 3416 N Cook Rd
- 1524 Jade Cove Dr
- 1567 Vine Leaf Dr
- 3458 Velma Dr
- 1765 Dew Place
- 3454 Velma Dr
- 3006 Coffman Ct SW
- 3354 Hannah Ct
- 3598 Velma Dr
- 719 Crossroad SW
- 1204 Commonwealth Ave SW
- 2180 Gus Robinson Rd
- 3001 Ashland Ct SW
- 3130 Plainsman Dr
- 1234 Wynford Colony SW
- 3119 Plainsman Dr
- 1518 Sage Ridge Dr
- 2866 Wynford Dr SW Unit 2
- 3555 Gus Way
- 3415 N Cook Rd
- 3411 N Cook Rd
- 3412 N Cook Rd
- 3410 N Cook Rd
- 3417 N Cook Rd
- 3414 N Cook Rd Unit II
- 3409 N Cook Rd Unit 3
- 3408 N Cook Rd
- 3416 N Cook Rd Unit 57
- 3419 N Cook Rd
- 3418 N Cook Rd
- 1569 Cooks Pond Dr Unit 2
- 3406 N Cook Rd Unit 3
- 1571 Cooks Pond Dr
- 3407 N Cook Rd Unit 3
- 3421 N Cook Rd
- 3405 N Cook Rd
- 1567 Cooks Pond Dr
- 1573 Cooks Pond Dr Unit 2
- 3423 N Cook Rd