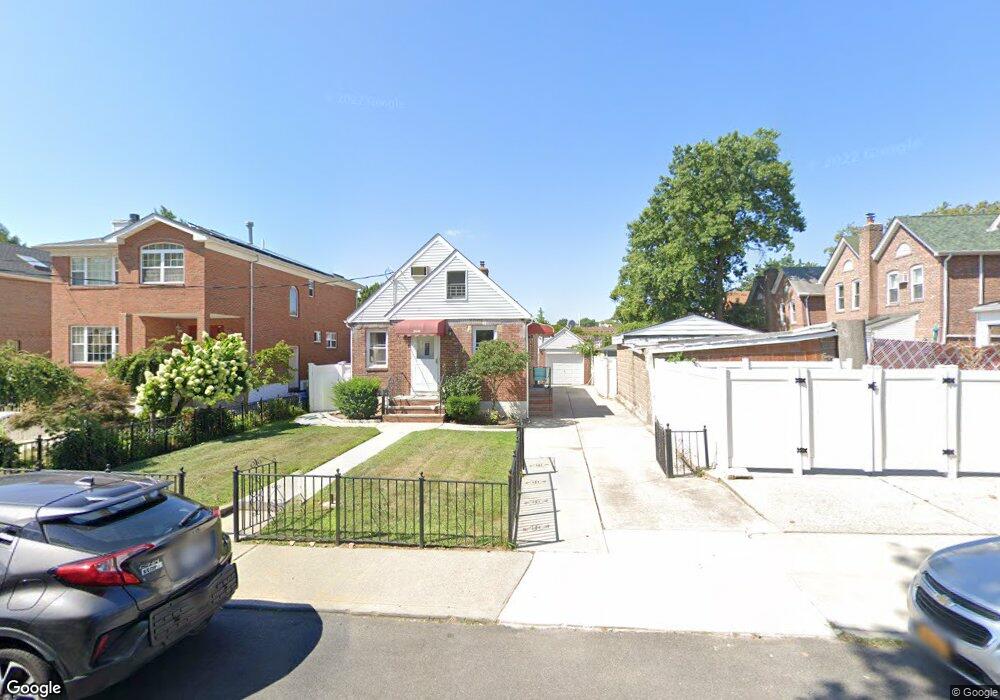
3414 202nd St Bayside, NY 11361
Auburndale NeighborhoodEstimated Value: $826,833 - $1,027,000
Studio
--
Bath
995
Sq Ft
$944/Sq Ft
Est. Value
About This Home
This home is located at 3414 202nd St, Bayside, NY 11361 and is currently estimated at $939,708, approximately $944 per square foot. 3414 202nd St is a home located in Queens County with nearby schools including P.S. 159 Queens, I.S. 25 Adrien Block, and Bayside High School.
Ownership History
Date
Name
Owned For
Owner Type
Purchase Details
Closed on
Apr 24, 2020
Sold by
Lee Gemma
Bought by
Lee John and Lee Rank Shik
Current Estimated Value
Home Financials for this Owner
Home Financials are based on the most recent Mortgage that was taken out on this home.
Original Mortgage
$364,642
Outstanding Balance
$320,442
Interest Rate
3.1%
Mortgage Type
New Conventional
Estimated Equity
$619,266
Purchase Details
Closed on
Dec 5, 2005
Sold by
Rivera William
Bought by
Lee Gemma
Home Financials for this Owner
Home Financials are based on the most recent Mortgage that was taken out on this home.
Original Mortgage
$330,000
Interest Rate
6.34%
Mortgage Type
Purchase Money Mortgage
Purchase Details
Closed on
Aug 13, 2001
Sold by
Cassara Mary
Bought by
Rivera William and Rivera Karen
Home Financials for this Owner
Home Financials are based on the most recent Mortgage that was taken out on this home.
Original Mortgage
$349,200
Interest Rate
6.91%
Purchase Details
Closed on
Aug 26, 1999
Sold by
Cassara Michael and Cassara Mary
Bought by
Cassara Mary
Create a Home Valuation Report for This Property
The Home Valuation Report is an in-depth analysis detailing your home's value as well as a comparison with similar homes in the area
Home Values in the Area
Average Home Value in this Area
Purchase History
| Date | Buyer | Sale Price | Title Company |
|---|---|---|---|
| Lee John | -- | -- | |
| Lee John | -- | -- | |
| Lee John | -- | -- | |
| Lee Gemma | $630,000 | -- | |
| Lee Gemma | $630,000 | -- | |
| Rivera William | -- | -- | |
| Rivera William | -- | -- | |
| Cassara Mary | -- | -- | |
| Cassara Mary | -- | -- |
Source: Public Records
Mortgage History
| Date | Status | Borrower | Loan Amount |
|---|---|---|---|
| Open | Lee John | $364,642 | |
| Closed | Lee John | $364,642 | |
| Closed | Lee Gemma | $330,000 | |
| Previous Owner | Rivera William | $349,200 |
Source: Public Records
Tax History
| Year | Tax Paid | Tax Assessment Tax Assessment Total Assessment is a certain percentage of the fair market value that is determined by local assessors to be the total taxable value of land and additions on the property. | Land | Improvement |
|---|---|---|---|---|
| 2025 | $8,729 | $46,066 | $12,667 | $33,399 |
| 2024 | $8,729 | $43,459 | $11,262 | $32,197 |
| 2023 | $8,596 | $42,798 | $11,937 | $30,861 |
| 2022 | $8,107 | $52,860 | $14,040 | $38,820 |
| 2021 | $8,200 | $46,080 | $14,040 | $32,040 |
| 2020 | $8,126 | $48,000 | $14,040 | $33,960 |
| 2019 | $7,576 | $49,680 | $14,040 | $35,640 |
| 2018 | $7,270 | $35,665 | $10,727 | $24,938 |
| 2017 | $6,898 | $33,840 | $11,044 | $22,796 |
| 2016 | $6,491 | $33,840 | $11,044 | $22,796 |
| 2015 | $3,850 | $31,990 | $13,770 | $18,220 |
| 2014 | $3,850 | $30,180 | $15,600 | $14,580 |
Source: Public Records
Map
Nearby Homes
- 200-14 34th Ave
- 20206 33rd Ave
- 3314 204th St
- 35-05 204th St Unit 245
- 204-11 34th Ave
- 34-32 205th St
- 35-27 203rd St
- 204-12 35th Ave Unit 254
- 35-12 205th St Unit 259
- 205-12 34th Ave
- 32-28 202nd St
- 3227 202nd St
- 20403 36th Ave Unit 397
- 35-42 205th St Unit 288
- 35-42 205th St Unit 287
- 35-31 205th St Unit 302
- 35-31 205th St Unit 299
- 34-12 192nd St
- 3226 204th St
- 35-29 205th St Unit 304
Your Personal Tour Guide
Ask me questions while you tour the home.