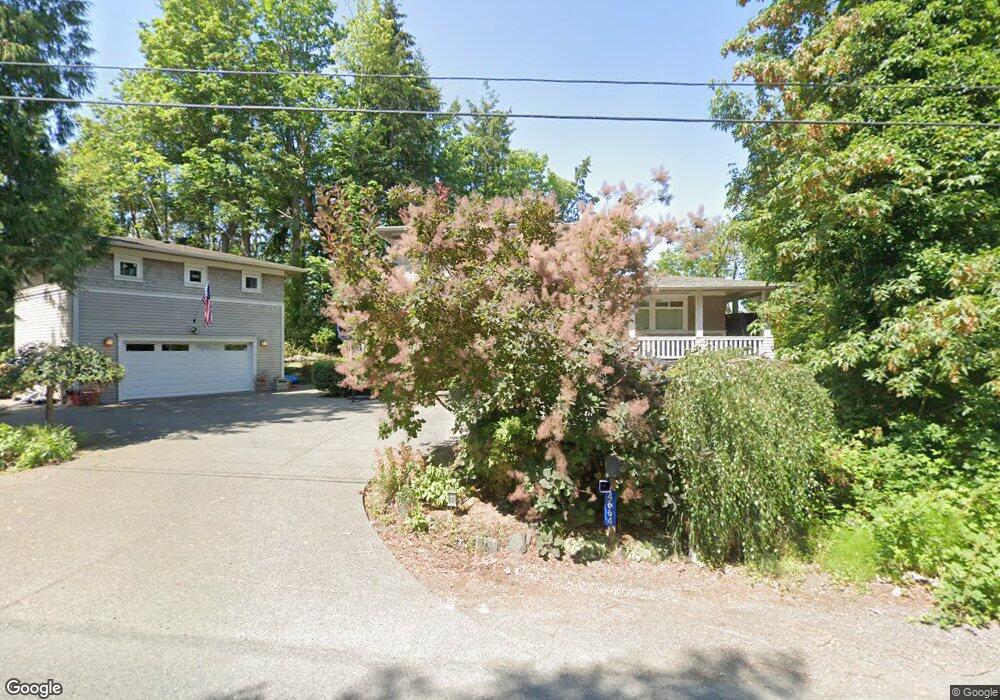
3414 E Hillcrest Dr Port Orchard, WA 98366
Estimated Value: $787,000 - $847,000
3
Beds
3
Baths
2,475
Sq Ft
$331/Sq Ft
Est. Value
About This Home
This home is located at 3414 E Hillcrest Dr, Port Orchard, WA 98366 and is currently estimated at $818,283, approximately $330 per square foot. 3414 E Hillcrest Dr is a home located in Kitsap County with nearby schools including Orchard Heights Elementary School, Marcus Whitman Middle School, and South Kitsap High School.
Ownership History
Date
Name
Owned For
Owner Type
Purchase Details
Closed on
Nov 30, 2005
Sold by
Sutton Brady T
Bought by
Gonia Keisha A
Current Estimated Value
Purchase Details
Closed on
Feb 2, 1999
Sold by
Johnson Frank N and Johnson Gregory C
Bought by
Gonia Keisha A and Sutton Brady T
Home Financials for this Owner
Home Financials are based on the most recent Mortgage that was taken out on this home.
Original Mortgage
$40,000
Interest Rate
6.79%
Create a Home Valuation Report for This Property
The Home Valuation Report is an in-depth analysis detailing your home's value as well as a comparison with similar homes in the area
Home Values in the Area
Average Home Value in this Area
Purchase History
| Date | Buyer | Sale Price | Title Company |
|---|---|---|---|
| Gonia Keisha A | -- | None Available | |
| Gonia Keisha A | $50,000 | Pacific Northwest Title |
Source: Public Records
Mortgage History
| Date | Status | Borrower | Loan Amount |
|---|---|---|---|
| Previous Owner | Gonia Keisha A | $40,000 |
Source: Public Records
Tax History Compared to Growth
Tax History
| Year | Tax Paid | Tax Assessment Tax Assessment Total Assessment is a certain percentage of the fair market value that is determined by local assessors to be the total taxable value of land and additions on the property. | Land | Improvement |
|---|---|---|---|---|
| 2026 | $6,040 | $702,270 | $108,870 | $593,400 |
| 2025 | $6,040 | $702,270 | $108,870 | $593,400 |
| 2024 | $5,857 | $702,270 | $108,870 | $593,400 |
| 2023 | $5,817 | $702,270 | $108,870 | $593,400 |
| 2022 | $5,636 | $569,320 | $87,270 | $482,050 |
| 2021 | $5,413 | $517,440 | $83,110 | $434,330 |
| 2020 | $5,422 | $503,520 | $78,580 | $424,940 |
| 2019 | $4,675 | $477,770 | $74,110 | $403,660 |
| 2018 | $4,937 | $380,890 | $67,080 | $313,810 |
| 2017 | $4,109 | $380,890 | $67,080 | $313,810 |
| 2016 | $4,306 | $365,870 | $63,890 | $301,980 |
| 2015 | $3,979 | $342,230 | $63,890 | $278,340 |
| 2014 | -- | $337,600 | $68,760 | $268,840 |
| 2013 | -- | $337,600 | $68,760 | $268,840 |
Source: Public Records
Map
Nearby Homes
- 3538 Beach Dr E
- 3643 Beach Dr E
- 5396 E Blaisdell Ln
- 5675 E Hillcrest Dr
- 4429 Waterman Ridge Ln E
- 3193 Woods Rd E
- 1021 Shore Dr
- 1315 Trenton Ave
- 609 Shore Dr
- 3016 E 19th St
- 1863 Connery Ln E
- 5495 E Collins Rd
- 1010 Perry Ave Unit 104
- 1118 Perry Ave
- 190 x Nipsic Ave
- 192 x Nipsic Ave
- 191 x Nipsic Ave
- 4898 E Collins Rd
- 5172 Rich View Dr E
- 0 Nevada Ave & Michigan St Unit NWM2365944