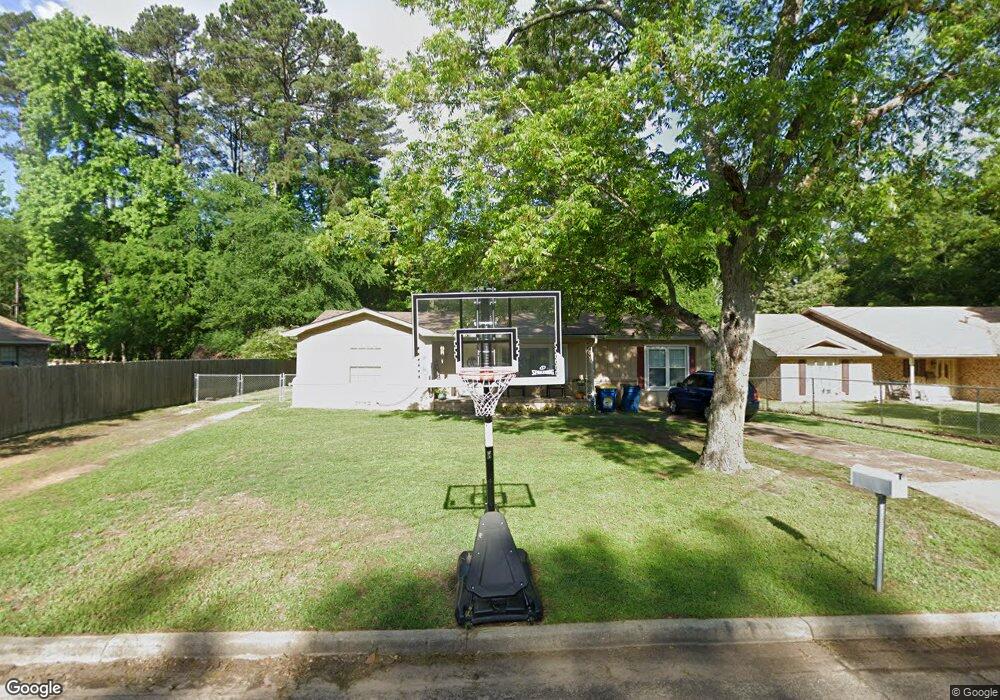
3415 Larkspur Ln Kilgore, TX 75662
Estimated Value: $162,000 - $191,000
--
Bed
--
Bath
1,488
Sq Ft
$115/Sq Ft
Est. Value
About This Home
This home is located at 3415 Larkspur Ln, Kilgore, TX 75662 and is currently estimated at $170,706, approximately $114 per square foot. 3415 Larkspur Ln is a home located in Rusk County with nearby schools including Kilgore Primary School, Chandler Elementary School, and Kilgore Intermediate School.
Ownership History
Date
Name
Owned For
Owner Type
Purchase Details
Closed on
Jul 31, 2006
Sold by
Griffin Jammie and Griffin Vanessa
Bought by
Crawford Hanna L and Crawford Joseph K
Current Estimated Value
Home Financials for this Owner
Home Financials are based on the most recent Mortgage that was taken out on this home.
Original Mortgage
$84,245
Outstanding Balance
$50,304
Interest Rate
6.66%
Mortgage Type
FHA
Estimated Equity
$120,402
Purchase Details
Closed on
Sep 26, 2005
Sold by
Citifinancial Mortgage Co Inc
Bought by
Griffin Jammie and Griffin Vanessa
Home Financials for this Owner
Home Financials are based on the most recent Mortgage that was taken out on this home.
Original Mortgage
$41,000
Interest Rate
7%
Mortgage Type
Purchase Money Mortgage
Purchase Details
Closed on
Jun 7, 2005
Sold by
Holcombe Pam and Holcombe Steve
Bought by
Citifinancial Mortgage Co Inc
Create a Home Valuation Report for This Property
The Home Valuation Report is an in-depth analysis detailing your home's value as well as a comparison with similar homes in the area
Home Values in the Area
Average Home Value in this Area
Purchase History
| Date | Buyer | Sale Price | Title Company |
|---|---|---|---|
| Crawford Hanna L | -- | -- | |
| Griffin Jammie | -- | None Available | |
| Citifinancial Mortgage Co Inc | $26,028 | -- |
Source: Public Records
Mortgage History
| Date | Status | Borrower | Loan Amount |
|---|---|---|---|
| Open | Crawford Hanna L | $84,245 | |
| Previous Owner | Griffin Jammie | $41,000 |
Source: Public Records
Tax History Compared to Growth
Tax History
| Year | Tax Paid | Tax Assessment Tax Assessment Total Assessment is a certain percentage of the fair market value that is determined by local assessors to be the total taxable value of land and additions on the property. | Land | Improvement |
|---|---|---|---|---|
| 2024 | $2,938 | $144,050 | $20,000 | $124,050 |
| 2023 | $2,631 | $129,320 | $20,000 | $109,320 |
| 2022 | $2,645 | $103,140 | $8,000 | $95,140 |
| 2021 | $2,245 | $88,400 | $8,000 | $80,400 |
| 2020 | $2,239 | $88,130 | $8,000 | $80,130 |
| 2019 | $2,296 | $88,130 | $8,000 | $80,130 |
| 2018 | $2,450 | $91,910 | $8,000 | $83,910 |
| 2017 | $2,366 | $91,910 | $8,000 | $83,910 |
| 2016 | $2,366 | $91,910 | $8,000 | $83,910 |
| 2015 | -- | $91,910 | $8,000 | $83,910 |
| 2014 | -- | $90,380 | $8,000 | $82,380 |
Source: Public Records
Map
Nearby Homes
- 3413 Larkspur Ln
- 409 409 McMichael
- 409 Mcmichael St
- 3412 Larkspur Ln
- 3414 Larkspur Ln
- 501 Mcmichael St
- TBD Mcmichael St
- 406 Mcmichael St
- 3408 3408 Larkspur
- 3409 Larkspur Ln
- 404 Mcmichael St
- 3501 Larkspur Ln
- 503 Mcmichael St
- 3408 Larkspur Ln
- 3500 Larkspur Ln
- 3406 Larkspur Ln
- 3413 Pinecrest St
- 3411 Pinecrest St
- 3503 Larkspur Ln
- 505 Mcmichael St