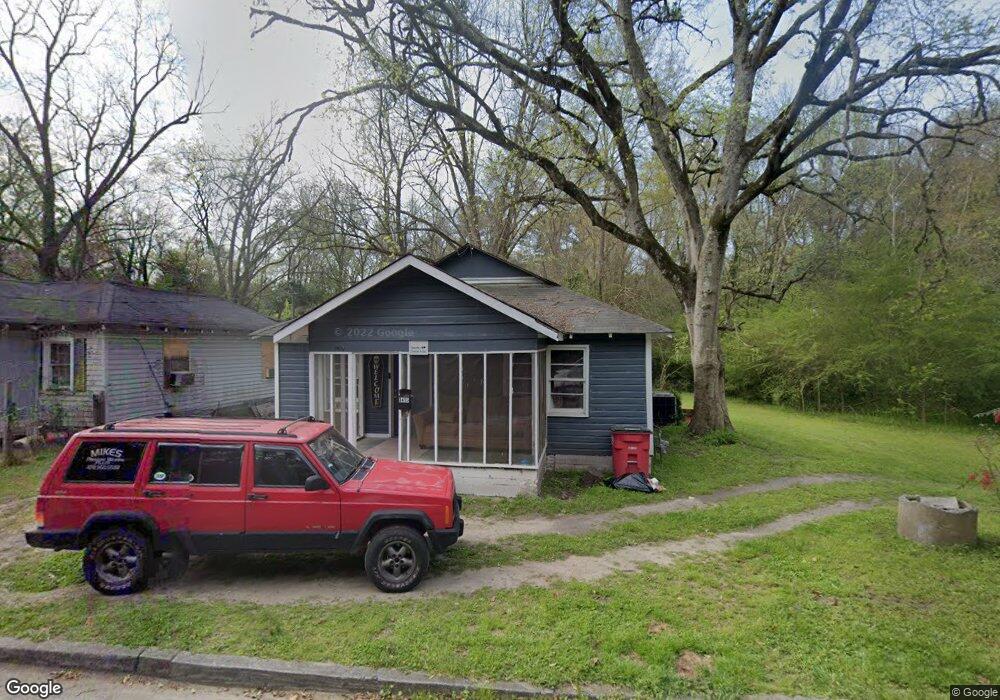
3415 Simmons St Macon, GA 31204
Estimated Value: $60,526 - $100,000
3
Beds
1
Bath
1,170
Sq Ft
$71/Sq Ft
Est. Value
About This Home
This home is located at 3415 Simmons St, Macon, GA 31204 and is currently estimated at $83,132, approximately $71 per square foot. 3415 Simmons St is a home located in Bibb County with nearby schools including Union Elementary School, Weaver Middle School, and Westside High School.
Ownership History
Date
Name
Owned For
Owner Type
Purchase Details
Closed on
Jan 21, 2021
Sold by
Nhr Solutions Inc
Bought by
Johnson Sheila H
Current Estimated Value
Purchase Details
Closed on
Feb 21, 2017
Sold by
Red Fish Rentals Llc
Bought by
Nhr Solutions Llc
Purchase Details
Closed on
May 23, 2016
Sold by
Ahsan Asif
Bought by
Red Fish Rentals Llc
Purchase Details
Closed on
Nov 28, 2012
Sold by
Trippco Llc
Bought by
The Mulberry Street Methodist Church Inc
Purchase Details
Closed on
Oct 31, 2009
Sold by
Cascade Investments Llc
Bought by
Trippco Llc
Purchase Details
Closed on
Oct 17, 2008
Sold by
Trippco Llc
Bought by
Cascade Investments Llc
Home Financials for this Owner
Home Financials are based on the most recent Mortgage that was taken out on this home.
Original Mortgage
$20,000
Interest Rate
6.34%
Mortgage Type
Seller Take Back
Purchase Details
Closed on
May 21, 2004
Bought by
Trippco Llc
Purchase Details
Closed on
May 12, 2004
Purchase Details
Closed on
Feb 3, 2004
Create a Home Valuation Report for This Property
The Home Valuation Report is an in-depth analysis detailing your home's value as well as a comparison with similar homes in the area
Home Values in the Area
Average Home Value in this Area
Purchase History
| Date | Buyer | Sale Price | Title Company |
|---|---|---|---|
| Johnson Sheila H | $11,500 | Jenkins Title Llc | |
| Johnson Sheila H | $11,500 | None Listed On Document | |
| Nhr Solutions Llc | $18,000 | -- | |
| Red Fish Rentals Llc | $2,500 | -- | |
| The Mulberry Street Methodist Church Inc | -- | None Available | |
| Trippco Llc | -- | None Available | |
| Cascade Investments Llc | $22,000 | None Available | |
| Trippco Llc | -- | -- | |
| -- | $10,000 | -- | |
| -- | $14,000 | -- |
Source: Public Records
Mortgage History
| Date | Status | Borrower | Loan Amount |
|---|---|---|---|
| Previous Owner | Cascade Investments Llc | $20,000 |
Source: Public Records
Tax History Compared to Growth
Tax History
| Year | Tax Paid | Tax Assessment Tax Assessment Total Assessment is a certain percentage of the fair market value that is determined by local assessors to be the total taxable value of land and additions on the property. | Land | Improvement |
|---|---|---|---|---|
| 2025 | $653 | $26,582 | $1,980 | $24,602 |
| 2024 | $643 | $25,332 | $1,800 | $23,532 |
| 2023 | $589 | $23,193 | $1,800 | $21,393 |
| 2022 | $159 | $11,586 | $776 | $10,810 |
| 2021 | $423 | $11,142 | $776 | $10,366 |
| 2020 | $433 | $11,142 | $776 | $10,366 |
| 2019 | $436 | $11,142 | $776 | $10,366 |
| 2018 | $848 | $11,142 | $776 | $10,366 |
| 2017 | $37 | $11,142 | $776 | $10,366 |
| 2016 | $299 | $8,649 | $776 | $7,874 |
| 2015 | $471 | $9,619 | $1,745 | $7,874 |
| 2014 | $542 | $9,619 | $1,745 | $7,874 |
Source: Public Records
Map
Nearby Homes
- 3419 Simmons St
- 3423 Simmons St
- 3431 Simmons St
- 3445 Simmons St
- 3412 Simmons St
- 3438 Simmons St
- 3440 Simmons St
- 3446 Simmons St
- 3603 Log Cabin Dr
- 4028 Suzanne Dr
- 3820 Robinson Rd
- 4030 Suzanne Dr
- 4032 Suzanne Dr
- 3868 Robinson Rd
- 0 Robinson Rd Unit 3152858
- 0 Robinson Rd
- 3890 Robinson Rd
- 4020 Suzanne Dr
- 3450 Simmons St
- 4038 Suzanne Dr