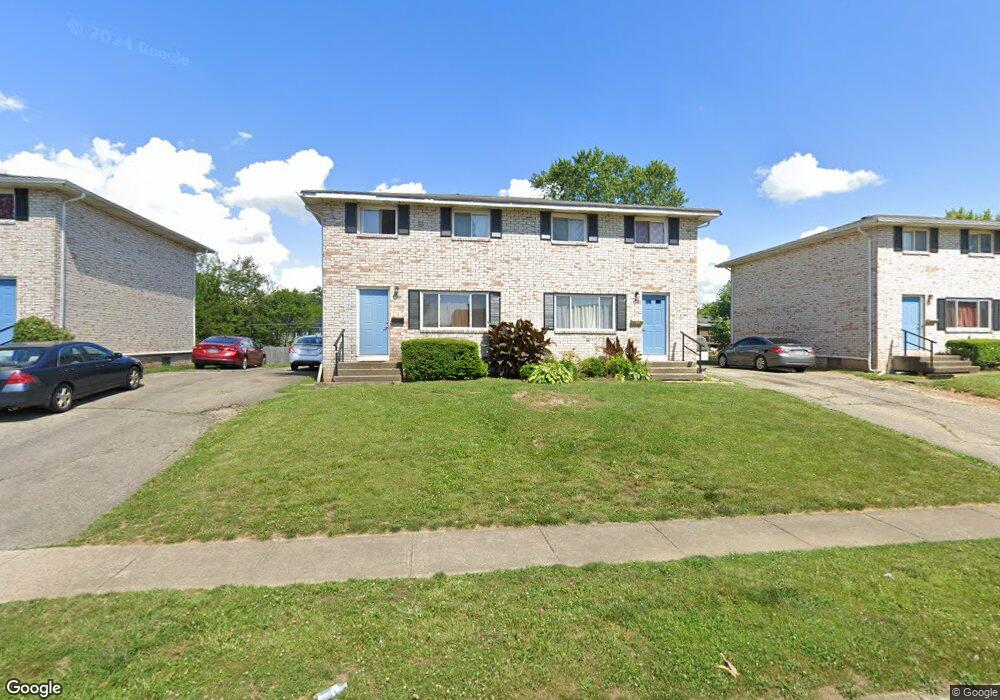
3416 Beachworth Dr Unit 3418 Columbus, OH 43232
East Columbus-White Ash NeighborhoodEstimated Value: $294,244 - $410,000
6
Beds
4
Baths
2,400
Sq Ft
$147/Sq Ft
Est. Value
About This Home
This home is located at 3416 Beachworth Dr Unit 3418, Columbus, OH 43232 and is currently estimated at $353,311, approximately $147 per square foot. 3416 Beachworth Dr Unit 3418 is a home located in Franklin County with nearby schools including Groveport Madison High School, Eastland Preparatory Academy, and Zenith Academy East.
Ownership History
Date
Name
Owned For
Owner Type
Purchase Details
Closed on
Jun 28, 2022
Sold by
Asmre Holdings Llc
Bought by
Apaai Holdings Llc
Current Estimated Value
Purchase Details
Closed on
Sep 15, 2021
Sold by
Walnut Management Llc
Bought by
Asmre Holdings Llc
Home Financials for this Owner
Home Financials are based on the most recent Mortgage that was taken out on this home.
Original Mortgage
$2,200,000
Interest Rate
2.8%
Mortgage Type
Commercial
Purchase Details
Closed on
Sep 8, 2021
Sold by
Vilardo Mary Jo and Helen Rose Vilardo Trust
Bought by
Walnut Management Llc
Home Financials for this Owner
Home Financials are based on the most recent Mortgage that was taken out on this home.
Original Mortgage
$2,200,000
Interest Rate
2.8%
Mortgage Type
Commercial
Purchase Details
Closed on
Sep 30, 2011
Sold by
Estates Of Philip Joseph Vilardo Sr
Bought by
Vilardo Helen Rose and Philip J Sr & Helen Rose Vilardo Inter V
Purchase Details
Closed on
Feb 1, 1971
Bought by
Vilardo Philip J
Create a Home Valuation Report for This Property
The Home Valuation Report is an in-depth analysis detailing your home's value as well as a comparison with similar homes in the area
Home Values in the Area
Average Home Value in this Area
Purchase History
| Date | Buyer | Sale Price | Title Company |
|---|---|---|---|
| Apaai Holdings Llc | -- | Columbus Title | |
| Asmre Holdings Llc | $2,005,000 | Columbus Ttl Agcy Of Westerv | |
| Walnut Management Llc | -- | Columbus Ttl Agcy Of Westerv | |
| Vilardo Helen Rose | -- | None Available | |
| Vilardo Philip J | -- | -- |
Source: Public Records
Mortgage History
| Date | Status | Borrower | Loan Amount |
|---|---|---|---|
| Previous Owner | Asmre Holdings Llc | $2,200,000 |
Source: Public Records
Tax History Compared to Growth
Tax History
| Year | Tax Paid | Tax Assessment Tax Assessment Total Assessment is a certain percentage of the fair market value that is determined by local assessors to be the total taxable value of land and additions on the property. | Land | Improvement |
|---|---|---|---|---|
| 2024 | $4,965 | $93,630 | $14,460 | $79,170 |
| 2023 | $4,725 | $93,625 | $14,455 | $79,170 |
| 2022 | $5,631 | $44,630 | $6,830 | $37,800 |
| 2021 | $2,752 | $44,630 | $6,830 | $37,800 |
| 2020 | $2,758 | $44,630 | $6,830 | $37,800 |
| 2019 | $2,613 | $37,210 | $5,710 | $31,500 |
| 2018 | $2,788 | $37,210 | $5,710 | $31,500 |
| 2017 | $2,634 | $37,210 | $5,710 | $31,500 |
| 2016 | $2,922 | $37,450 | $6,160 | $31,290 |
| 2015 | $2,949 | $37,450 | $6,160 | $31,290 |
| 2014 | $2,779 | $37,450 | $6,160 | $31,290 |
| 2013 | $1,137 | $37,450 | $6,160 | $31,290 |
Source: Public Records
Map
Nearby Homes
- 4655 Glengate Dr
- 4496 Reinbeau Dr
- 4468 Reinbeau Dr
- 4521 Helen Dr
- 4485 Helen Dr
- 4486 Helen Dr
- 4479 Gerling Blvd
- 4940 Brewster Dr
- 5004 Bentler Dr
- 5044 Albany Dr
- 3856 Crestfield Dr Unit 3856
- 3721 Aurelia Dr
- 3900 Noe Bixby Rd
- 3567 Wymore Place
- 5106 Harbor Blvd
- 3493 Tremaine Rd
- 5096 Fullerton Dr
- 4783 Nieles Edge Dr
- 5145 Fullerton Dr
- 5174 Fullerton Dr
- 3408 Beachworth Dr Unit 3410
- 3424 Beachworth Dr Unit 3426
- 3423 Burbank Rd
- 3434 Beachworth Dr Unit 3436
- 3429 Burbank Rd
- 3400 Beachworth Dr Unit 3402
- 3415 Burbank Rd
- 3411 Beachworth Dr
- 3437 Burbank Rd
- 3405 Burbank Rd
- 3394 Beachworth Dr Unit 3396
- 3443 Burbank Rd
- 3399 Burbank Rd
- 4533 Reinbeau Dr Unit 4535
- 3455 Burbank Rd
- 3389 Beachworth Dr Unit A, B, C, D
- 3422 Burbank Rd
- 3430 Burbank Rd
- 4549 Reinbeau Dr
- 3414 Burbank Rd