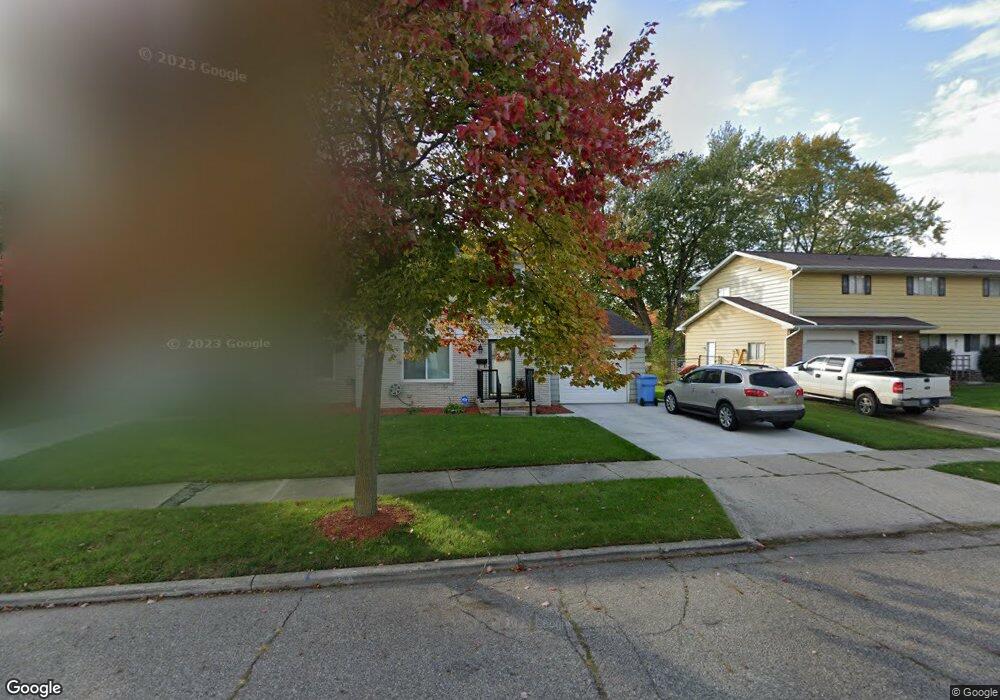
3416 Davidson Dr Lansing, MI 48910
Old Everett NeighborhoodEstimated Value: $201,000 - $249,377
5
Beds
2
Baths
2,422
Sq Ft
$94/Sq Ft
Est. Value
About This Home
This home is located at 3416 Davidson Dr, Lansing, MI 48910 and is currently estimated at $228,344, approximately $94 per square foot. 3416 Davidson Dr is a home located in Ingham County with nearby schools including Kendon School, Attwood School, and Everett High School.
Ownership History
Date
Name
Owned For
Owner Type
Purchase Details
Closed on
Sep 23, 2024
Sold by
Dysart Princilla Roxanne
Bought by
Dysart Princilla Roxanne and Dysart Derrick
Current Estimated Value
Purchase Details
Closed on
May 12, 2020
Sold by
Dysart Princilla R
Bought by
Dysart Priniclla R and Dysart Randall
Purchase Details
Closed on
Feb 5, 1999
Sold by
Dysart Princilla R and Dysart Derrick
Bought by
Dysart Princilla R
Home Financials for this Owner
Home Financials are based on the most recent Mortgage that was taken out on this home.
Original Mortgage
$106,050
Interest Rate
6.92%
Mortgage Type
Purchase Money Mortgage
Purchase Details
Closed on
Aug 8, 1996
Sold by
Karaga Saied
Bought by
Dysart Princilla
Create a Home Valuation Report for This Property
The Home Valuation Report is an in-depth analysis detailing your home's value as well as a comparison with similar homes in the area
Home Values in the Area
Average Home Value in this Area
Purchase History
| Date | Buyer | Sale Price | Title Company |
|---|---|---|---|
| Dysart Princilla Roxanne | -- | None Listed On Document | |
| Dysart Princilla Roxanne | -- | None Listed On Document | |
| Dysart Priniclla R | -- | None Available | |
| Dysart Princilla R | -- | First American Title Ins Co | |
| Dysart Princilla | $104,500 | -- |
Source: Public Records
Mortgage History
| Date | Status | Borrower | Loan Amount |
|---|---|---|---|
| Previous Owner | Dysart Princilla R | $106,050 |
Source: Public Records
Tax History
| Year | Tax Paid | Tax Assessment Tax Assessment Total Assessment is a certain percentage of the fair market value that is determined by local assessors to be the total taxable value of land and additions on the property. | Land | Improvement |
|---|---|---|---|---|
| 2025 | $4,938 | $139,800 | $14,800 | $125,000 |
| 2024 | $45 | $104,900 | $14,800 | $90,100 |
| 2023 | $5,188 | $103,200 | $14,800 | $88,400 |
| 2022 | $4,738 | $90,200 | $13,400 | $76,800 |
| 2021 | $4,628 | $88,000 | $7,300 | $80,700 |
| 2020 | $4,097 | $64,700 | $7,300 | $57,400 |
| 2019 | $3,942 | $59,100 | $7,300 | $51,800 |
| 2018 | $3,721 | $52,900 | $7,300 | $45,600 |
| 2017 | $3,573 | $52,900 | $7,300 | $45,600 |
| 2016 | $4,264 | $66,800 | $7,300 | $59,500 |
| 2015 | $4,264 | $64,400 | $14,631 | $49,769 |
| 2014 | $4,264 | $64,800 | $12,480 | $52,320 |
Source: Public Records
Map
Nearby Homes
- 114 W Berry Ave
- 3319 Jewell Ave
- 416 W Holmes Rd
- 3430 Palmer St
- 3209 Stabler St
- 3805 Donald St
- 3723 Weger Place
- 320 E Hodge Ave
- 4022 Stabler St
- 3140 S Cedar St
- 215 Dunlap St
- 3429 Lowcroft Ave
- 218 Dunlap St
- 413 E Hodge Ave
- 334 Dunlap St
- 410 Dunlap St
- 3705 Burchfield Dr
- 616 Glendale Ave
- 0 Burchfield Dr
- 3815 Walton Dr
- 3408/3410 Davidson Dr
- 3408 Davidson Dr
- 3417 Davidson Dr
- 3421 Davidson Dr
- 201 W Holmes Rd Unit A
- 15 W Holmes Rd
- 3507 Davidson Dr
- 3422 Stabler St
- 3416 Stabler St
- 3428 Stabler St
- 3404 Stabler St
- 3515 Davidson Dr
- 3506 Stabler St
- 0 Stabler St
- 3523 Davidson Dr
- 3509 Davidson Dr
- 0 Davidson Dr
- 0 Davidson Dr
- 3514 Stabler St
- 126 W Holmes Rd
Your Personal Tour Guide
Ask me questions while you tour the home.