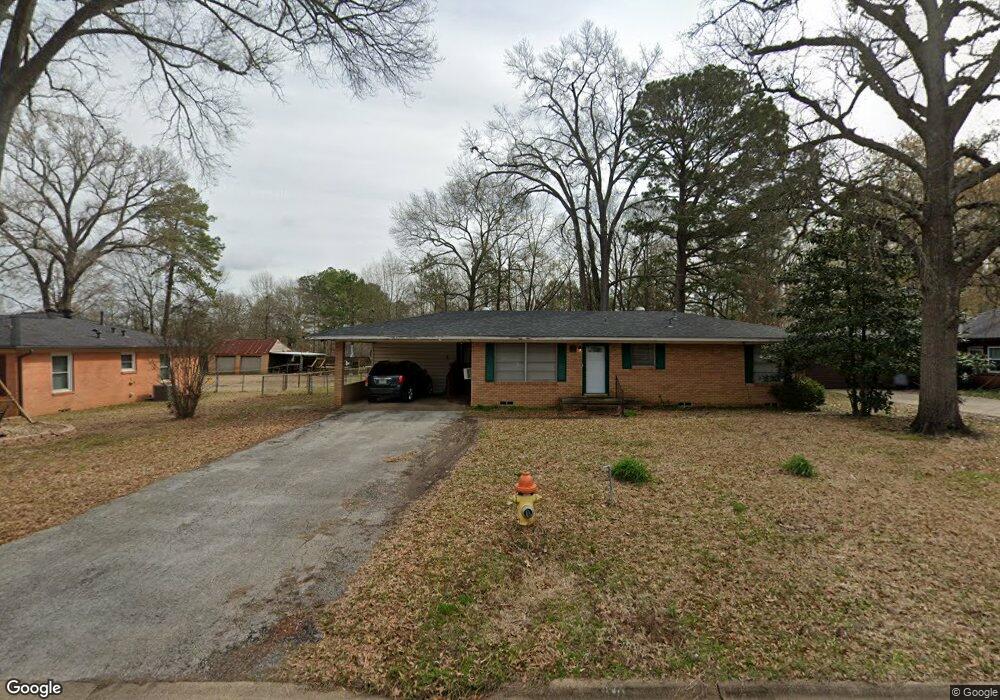
3416 Duncan St Kilgore, TX 75662
Estimated Value: $131,000 - $160,000
--
Bed
--
Bath
1,075
Sq Ft
$131/Sq Ft
Est. Value
About This Home
This home is located at 3416 Duncan St, Kilgore, TX 75662 and is currently estimated at $140,850, approximately $131 per square foot. 3416 Duncan St is a home located in Rusk County with nearby schools including Kilgore Primary School, Chandler Elementary School, and Kilgore Intermediate School.
Ownership History
Date
Name
Owned For
Owner Type
Purchase Details
Closed on
Feb 23, 2018
Sold by
Nichols Kenneth Craig
Bought by
Hermosillo Jaime and Garcia Rosalina
Current Estimated Value
Home Financials for this Owner
Home Financials are based on the most recent Mortgage that was taken out on this home.
Original Mortgage
$62,500
Outstanding Balance
$44,636
Interest Rate
3.99%
Mortgage Type
Seller Take Back
Estimated Equity
$96,214
Purchase Details
Closed on
Dec 16, 2016
Sold by
Nichols Kenneth Craig
Bought by
Byrd Jonathan Glenn
Home Financials for this Owner
Home Financials are based on the most recent Mortgage that was taken out on this home.
Original Mortgage
$60,500
Interest Rate
3.54%
Mortgage Type
Commercial
Purchase Details
Closed on
Jul 14, 2016
Sold by
Davis Marjorie G and Davis Marjorie Gudrene
Bought by
Nichols Kenneth Craig
Purchase Details
Closed on
Jul 11, 2016
Sold by
Davis Marjorie G
Bought by
Nichols Kenneth Craig
Create a Home Valuation Report for This Property
The Home Valuation Report is an in-depth analysis detailing your home's value as well as a comparison with similar homes in the area
Home Values in the Area
Average Home Value in this Area
Purchase History
| Date | Buyer | Sale Price | Title Company |
|---|---|---|---|
| Hermosillo Jaime | -- | None Available | |
| Byrd Jonathan Glenn | -- | None Available | |
| Nichols Kenneth Craig | -- | None Available | |
| Nichols Kenneth Craig | $30,100 | None Available |
Source: Public Records
Mortgage History
| Date | Status | Borrower | Loan Amount |
|---|---|---|---|
| Open | Hermosillo Jaime | $62,500 | |
| Previous Owner | Byrd Jonathan Glenn | $60,500 |
Source: Public Records
Tax History Compared to Growth
Tax History
| Year | Tax Paid | Tax Assessment Tax Assessment Total Assessment is a certain percentage of the fair market value that is determined by local assessors to be the total taxable value of land and additions on the property. | Land | Improvement |
|---|---|---|---|---|
| 2024 | $2,460 | $115,090 | $20,000 | $95,090 |
| 2023 | $2,203 | $103,350 | $20,000 | $83,350 |
| 2022 | $2,215 | $85,230 | $10,000 | $75,230 |
| 2021 | $1,880 | $74,020 | $10,000 | $64,020 |
| 2020 | $1,770 | $69,680 | $10,000 | $59,680 |
| 2019 | $2,163 | $83,040 | $10,000 | $73,040 |
| 2018 | $2,214 | $83,040 | $10,000 | $73,040 |
| 2017 | $2,138 | $83,040 | $10,000 | $73,040 |
| 2016 | $2,138 | $83,040 | $10,000 | $73,040 |
| 2015 | -- | $83,040 | $10,000 | $73,040 |
| 2014 | -- | $73,840 | $10,000 | $63,840 |
Source: Public Records
Map
Nearby Homes
- 619 Peterson Rd
- 3411 Larkspur Ln
- 501 Beckley St
- 402 Beckley St
- 509 Turner St
- 624 Camp St
- 908 Camp St
- 632 Leach St
- 2901 Sunset Ln
- 718 Bean Ave
- 3302 Forrest St
- 2509 Broadway Blvd
- 2617 Florence St
- 1404 Leach St
- 2419 Broadway Blvd
- 2414 S Martin St
- 1612 E Leach
- 703 Monroe St
- 1203 Penny Ln
- 1501 Remington Ct
- 3418 Duncan St
- 3414 Duncan St
- 3417 Duncan St
- 3419 Duncan St
- 3422 Duncan St
- 3415 Duncan St
- 3412 Duncan St
- 3421 Duncan St
- 3413 Duncan St
- 3424 3424 Duncan
- 3424 Duncan St
- 3425 Duncan St
- 3408 Duncan St
- 3409 Duncan St
- 3500 Pinecrest St
- 3418 Pinecrest Dr
- 3418 Pinecrest St
- 3416 Pinecrest St
- 3427 Duncan St
- 3502 Pinecrest St