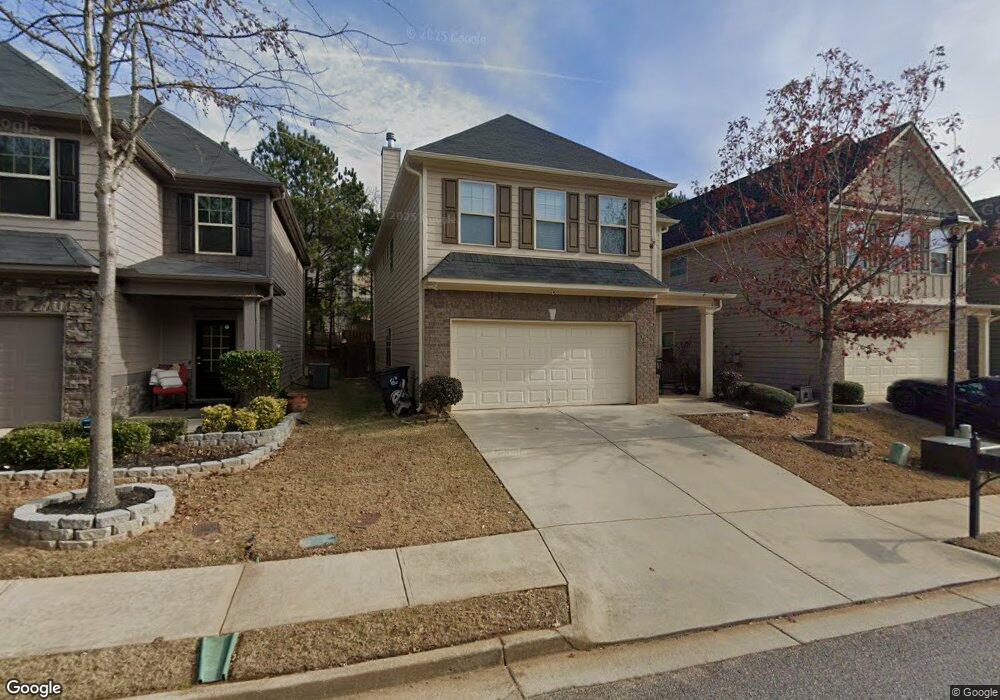
3417 Greyhawk Crossing Buford, GA 30519
Estimated Value: $419,000 - $437,000
3
Beds
3
Baths
2,240
Sq Ft
$191/Sq Ft
Est. Value
About This Home
This home is located at 3417 Greyhawk Crossing, Buford, GA 30519 and is currently estimated at $428,225, approximately $191 per square foot. 3417 Greyhawk Crossing is a home with nearby schools including Patrick Elementary School, Glenn C. Jones Middle School, and Old Suwanee Christian School.
Ownership History
Date
Name
Owned For
Owner Type
Purchase Details
Closed on
Apr 7, 2022
Sold by
Cooper Marcus Ryan
Bought by
Cooper Marcus Ryan and Cooper Deanna Lee
Current Estimated Value
Home Financials for this Owner
Home Financials are based on the most recent Mortgage that was taken out on this home.
Original Mortgage
$272,000
Outstanding Balance
$253,474
Interest Rate
3.85%
Mortgage Type
New Conventional
Estimated Equity
$174,751
Purchase Details
Closed on
Sep 26, 2019
Sold by
Davis Sandra
Bought by
Cooper Marcus Ryan
Home Financials for this Owner
Home Financials are based on the most recent Mortgage that was taken out on this home.
Original Mortgage
$257,254
Interest Rate
3.62%
Mortgage Type
FHA
Purchase Details
Closed on
Sep 10, 2015
Sold by
Sdc Gwinnett Llc
Bought by
Davis Sandra
Home Financials for this Owner
Home Financials are based on the most recent Mortgage that was taken out on this home.
Original Mortgage
$190,060
Interest Rate
3.97%
Mortgage Type
Commercial
Purchase Details
Closed on
Apr 24, 2015
Sold by
Highland Falls Llc
Bought by
Sdc Gwinnett Llc
Create a Home Valuation Report for This Property
The Home Valuation Report is an in-depth analysis detailing your home's value as well as a comparison with similar homes in the area
Home Values in the Area
Average Home Value in this Area
Purchase History
| Date | Buyer | Sale Price | Title Company |
|---|---|---|---|
| Cooper Marcus Ryan | -- | -- | |
| Cooper Marcus Ryan | $262,000 | -- | |
| Davis Sandra | $205,060 | -- | |
| Sdc Gwinnett Llc | -- | -- | |
| Highland Falls Llc | $1,880,250 | -- |
Source: Public Records
Mortgage History
| Date | Status | Borrower | Loan Amount |
|---|---|---|---|
| Open | Cooper Marcus Ryan | $272,000 | |
| Previous Owner | Cooper Marcus Ryan | $257,254 | |
| Previous Owner | Davis Sandra | $190,060 |
Source: Public Records
Tax History Compared to Growth
Tax History
| Year | Tax Paid | Tax Assessment Tax Assessment Total Assessment is a certain percentage of the fair market value that is determined by local assessors to be the total taxable value of land and additions on the property. | Land | Improvement |
|---|---|---|---|---|
| 2025 | $5,155 | $176,600 | $32,800 | $143,800 |
| 2024 | $5,199 | $171,760 | $34,800 | $136,960 |
| 2023 | $5,199 | $177,720 | $34,800 | $142,920 |
| 2022 | $4,815 | $154,720 | $26,800 | $127,920 |
| 2021 | $3,813 | $103,760 | $20,320 | $83,440 |
| 2020 | $3,837 | $103,760 | $20,320 | $83,440 |
| 2019 | $3,570 | $103,760 | $20,320 | $83,440 |
| 2018 | $3,570 | $93,920 | $18,000 | $75,920 |
| 2016 | $3,122 | $82,000 | $15,600 | $66,400 |
| 2015 | $518 | $14,040 | $14,040 | $0 |
| 2014 | $171 | $4,240 | $4,240 | $0 |
Source: Public Records
Map
Nearby Homes
- 3367 Greyhawk Crossing
- 2689 Woodward Down Trail NE
- 1785 Plunketts Rd
- 2939 Woodward Down Trail
- 1510 Oklahoma Dr
- 1466 Clarecastle Ln
- 1320 Newbridge Cir
- 3570 Knoll Crest Trail
- 3790 Salvia Dr
- 3641 Deaton Trail
- 2852 Habibi Ct
- 2850 Habibi Ct
- 1781 Plunketts Rd
- 3735 Fir Dr
- 4152 Adler Cir
- 3962 Adler Cir Unit 7
- 3962 Adler Cir
- 4152 Adler Cir Unit 42
- 3407 Greyhawk Crossing
- 3427 Greyhawk Crossing
- 3397 Greyhawk Crossing
- 3437 Greyhawk Crossing
- 3368 Woodward Down Trail
- 3378 Woodward Down Trail
- 3387 Greyhawk Crossing
- 3358 Woodward Down Trail
- 3377 Greyhawk Crossing
- 3398 Woodward Down Trail NE
- 3416 Greyhawk Crossing
- 3348 Woodward Down Trail
- 3408 Woodward Down Trail
- 3338 Woodward Down Trail
- 3328 Woodward Down Trail NE
- 3457 Greyhawk Crossing
- 3446 Greyhawk Crossing
- 0 Greyhawk Crossing Unit 8457486
- 0 Greyhawk Crossing Unit 7591659
- 0 Greyhawk Crossing Unit 7527244