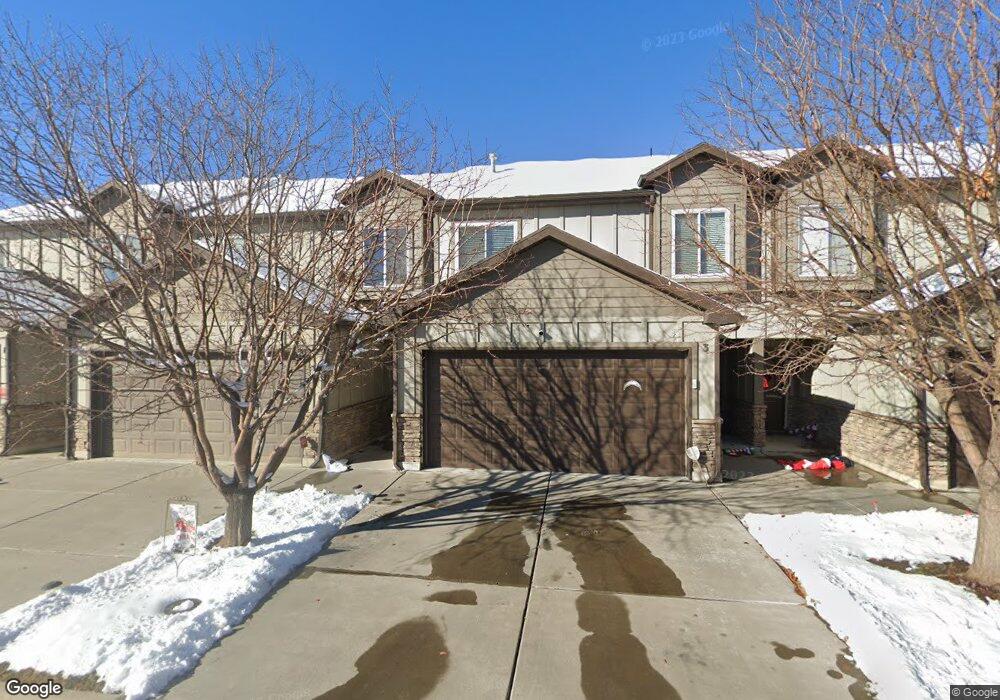
3417 S Kenna Ln Unit 2 West Haven, UT 84401
Estimated Value: $335,000 - $357,000
3
Beds
3
Baths
1,356
Sq Ft
$256/Sq Ft
Est. Value
About This Home
This home is located at 3417 S Kenna Ln Unit 2, West Haven, UT 84401 and is currently estimated at $347,417, approximately $256 per square foot. 3417 S Kenna Ln Unit 2 is a home located in Weber County with nearby schools including North Park School, Sand Ridge Junior High School, and Roy High School.
Ownership History
Date
Name
Owned For
Owner Type
Purchase Details
Closed on
Jun 8, 2023
Sold by
Knight Karen D
Bought by
Carrozza Berkley K and Musser Eliza
Current Estimated Value
Home Financials for this Owner
Home Financials are based on the most recent Mortgage that was taken out on this home.
Original Mortgage
$343,660
Outstanding Balance
$334,233
Interest Rate
6.25%
Mortgage Type
FHA
Estimated Equity
$13,184
Purchase Details
Closed on
Sep 11, 2008
Sold by
Riverbend Associates Llc
Bought by
Stone Grace A
Home Financials for this Owner
Home Financials are based on the most recent Mortgage that was taken out on this home.
Original Mortgage
$158,613
Interest Rate
6.5%
Mortgage Type
FHA
Create a Home Valuation Report for This Property
The Home Valuation Report is an in-depth analysis detailing your home's value as well as a comparison with similar homes in the area
Home Values in the Area
Average Home Value in this Area
Purchase History
| Date | Buyer | Sale Price | Title Company |
|---|---|---|---|
| Carrozza Berkley K | -- | Amicus Title | |
| Stone Grace A | -- | Mountain View Title Ogden |
Source: Public Records
Mortgage History
| Date | Status | Borrower | Loan Amount |
|---|---|---|---|
| Open | Carrozza Berkley K | $343,660 | |
| Closed | Carrozza Berkley K | $20,619 | |
| Previous Owner | Stone Grace A | $158,613 |
Source: Public Records
Tax History Compared to Growth
Tax History
| Year | Tax Paid | Tax Assessment Tax Assessment Total Assessment is a certain percentage of the fair market value that is determined by local assessors to be the total taxable value of land and additions on the property. | Land | Improvement |
|---|---|---|---|---|
| 2025 | $1,847 | $337,540 | $85,000 | $252,540 |
| 2024 | $1,766 | $180,950 | $46,750 | $134,200 |
| 2023 | $1,733 | $176,000 | $46,750 | $129,250 |
| 2022 | $1,789 | $185,900 | $46,750 | $139,150 |
| 2021 | $1,433 | $253,000 | $35,000 | $218,000 |
| 2020 | $1,345 | $218,000 | $35,000 | $183,000 |
| 2019 | $1,376 | $211,000 | $35,000 | $176,000 |
| 2018 | $1,226 | $180,000 | $27,000 | $153,000 |
| 2017 | $1,127 | $161,000 | $30,000 | $131,000 |
| 2016 | $1,102 | $85,250 | $16,500 | $68,750 |
| 2015 | $993 | $75,900 | $13,750 | $62,150 |
| 2014 | $877 | $65,450 | $13,750 | $51,700 |
Source: Public Records
Map
Nearby Homes
- 3420 S Hazel Ave Unit 61
- 3419 S Erin Ave
- 2373 W Howard St
- 2354 Leigh Ln Unit G26-27
- 2351 James Way Unit F23
- 2448 W Anne Ave
- 2459 W Glover Ln
- 2383 W 3225 S
- 3243 S 2400 W
- 3154 W 3125 S Unit 18
- 3165 W 3125 S Unit 15
- 3153 W 3125 S Unit 17
- 3159 W 3125 S Unit 16
- 3171 W 3125 S Unit 14
- 3177 W 3125 S Unit 13
- 3045 S 2275 St W
- 3860 Midland Dr Unit C10
- 3860 Midland Dr Unit A18
- 3860 Midland Dr Unit B32
- 3750 Midland Dr Unit 169
- 3417 S Kenna Ln Unit 3
- 3417 S Kenna Ln Unit 4
- 3417 Kenna Ln Unit 6
- 3417 Kenna Ln Unit 5
- 3417 Kenna Ln Unit 4
- 3417 Kenna Ln Unit 3
- 3417 Kenna Ln Unit 2
- 3417 Kenna Ln Unit 1
- 3417 Kenna Ln
- 3402 Kenna Ln Unit 5
- 3402 Kenna Ln Unit 4
- 3402 Kenna Ln Unit 3
- 3402 Kenna Ln Unit 2
- 3402 Kenna Ln Unit 1
- 3389 Kenna Ln Unit 6
- 3389 Kenna Ln Unit 5
- 3389 Kenna Ln Unit 4
- 3389 Kenna Ln Unit 3
- 3389 Kenna Ln Unit 2
- 3389 Kenna Ln Unit 1