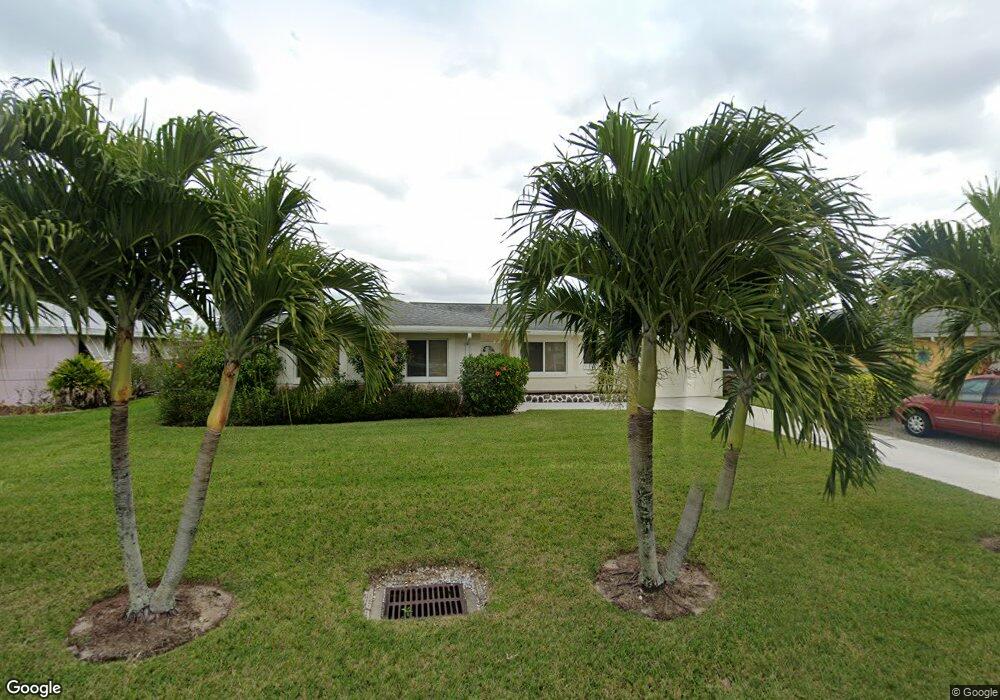
3417 SE 18th Ave Cape Coral, FL 33904
Caloosahatchee NeighborhoodEstimated Value: $434,015 - $554,000
3
Beds
2
Baths
1,877
Sq Ft
$261/Sq Ft
Est. Value
About This Home
This home is located at 3417 SE 18th Ave, Cape Coral, FL 33904 and is currently estimated at $489,504, approximately $260 per square foot. 3417 SE 18th Ave is a home located in Lee County with nearby schools including Cape Elementary School, Caloosa Elementary School, and Tropic Isles Elementary School.
Ownership History
Date
Name
Owned For
Owner Type
Purchase Details
Closed on
Dec 14, 2020
Sold by
Leuchte Juergen
Bought by
Woltersdorf Michael John
Current Estimated Value
Home Financials for this Owner
Home Financials are based on the most recent Mortgage that was taken out on this home.
Original Mortgage
$224,000
Outstanding Balance
$199,427
Interest Rate
2.7%
Mortgage Type
New Conventional
Estimated Equity
$290,077
Purchase Details
Closed on
Feb 13, 2013
Sold by
Tennikat Monuela and Orthmann Kurt
Bought by
Leuchte Jurgen
Purchase Details
Closed on
Feb 22, 2010
Sold by
Simeone Peter Frank
Bought by
Tennikat Monuela and Orthmann Kurt
Purchase Details
Closed on
Sep 20, 2001
Sold by
Benitez Brittanie and Simeone Brittanie
Bought by
Simeone Peter Frank
Home Financials for this Owner
Home Financials are based on the most recent Mortgage that was taken out on this home.
Original Mortgage
$129,600
Interest Rate
6.89%
Mortgage Type
New Conventional
Create a Home Valuation Report for This Property
The Home Valuation Report is an in-depth analysis detailing your home's value as well as a comparison with similar homes in the area
Home Values in the Area
Average Home Value in this Area
Purchase History
| Date | Buyer | Sale Price | Title Company |
|---|---|---|---|
| Woltersdorf Michael John | $320,000 | Fidelity National Title | |
| Leuchte Jurgen | $197,500 | Attorney | |
| Tennikat Monuela | $145,000 | Omega Title Llc | |
| Simeone Peter Frank | $62,300 | -- |
Source: Public Records
Mortgage History
| Date | Status | Borrower | Loan Amount |
|---|---|---|---|
| Open | Woltersdorf Michael John | $224,000 | |
| Previous Owner | Simeone Peter Frank | $129,600 |
Source: Public Records
Tax History Compared to Growth
Tax History
| Year | Tax Paid | Tax Assessment Tax Assessment Total Assessment is a certain percentage of the fair market value that is determined by local assessors to be the total taxable value of land and additions on the property. | Land | Improvement |
|---|---|---|---|---|
| 2025 | $7,104 | $405,305 | -- | -- |
| 2024 | $7,104 | $368,459 | -- | -- |
| 2023 | $6,992 | $334,963 | $0 | $0 |
| 2022 | $6,202 | $304,512 | $0 | $0 |
| 2021 | $5,365 | $276,829 | $163,456 | $113,373 |
| 2020 | $4,827 | $236,593 | $146,000 | $90,593 |
| 2019 | $4,763 | $239,829 | $175,000 | $64,829 |
| 2018 | $4,411 | $210,760 | $142,000 | $68,760 |
| 2017 | $4,298 | $212,374 | $165,000 | $47,374 |
| 2016 | $3,878 | $178,160 | $165,090 | $13,070 |
| 2015 | $3,931 | $177,403 | $165,084 | $12,319 |
| 2014 | $4,335 | $193,304 | $140,346 | $52,958 |
| 2013 | -- | $177,178 | $134,734 | $42,444 |
Source: Public Records
Map
Nearby Homes
- 3502 SE 18th Place Unit 12
- 3517 SE 18th Ave
- 3347 SE 18th Ave
- 3605 SE 18th Ave
- 3347 SE 19th Ave
- 3505 SE 16th Place
- 3405 SE 16th Place
- 3610 SE 18th Place
- 1911 SE 35th St
- 1936 Palaco Grande Pkwy
- 3528 SE 16th Place
- 3339 SE 16th Place
- 3614 SE 17th Ave
- 3701 SE 17th Place
- 3619 SE 16th Place
- 1935 SE 36th Terrace
- 1950 SE 36th St
- 3728 SE 18th Ave
- 3418 SE 15th Place
- 1523 SE 36th Terrace
- 3413 SE 18th Ave
- 3501 SE 18th Ave
- 3505 SE 18th Ave
- 3409 SE 18th Ave
- 3418 SE 18th Ave
- 3414 SE 18th Ave
- 3502 SE 18th Ave
- 3418 SE 18th Place
- 3414 SE 18th Place
- 3405 SE 18th Ave
- 3509 SE 18th Ave
- 3506 SE 18th Ave
- 3410 SE 18th Ave
- 3506 SE 18th Place
- 3510 SE 18th Ave
- 3513 SE 18th Ave
- 3404 SE 18th Ave
- 0 SE 18th Place
- 3406 SE 18th Place