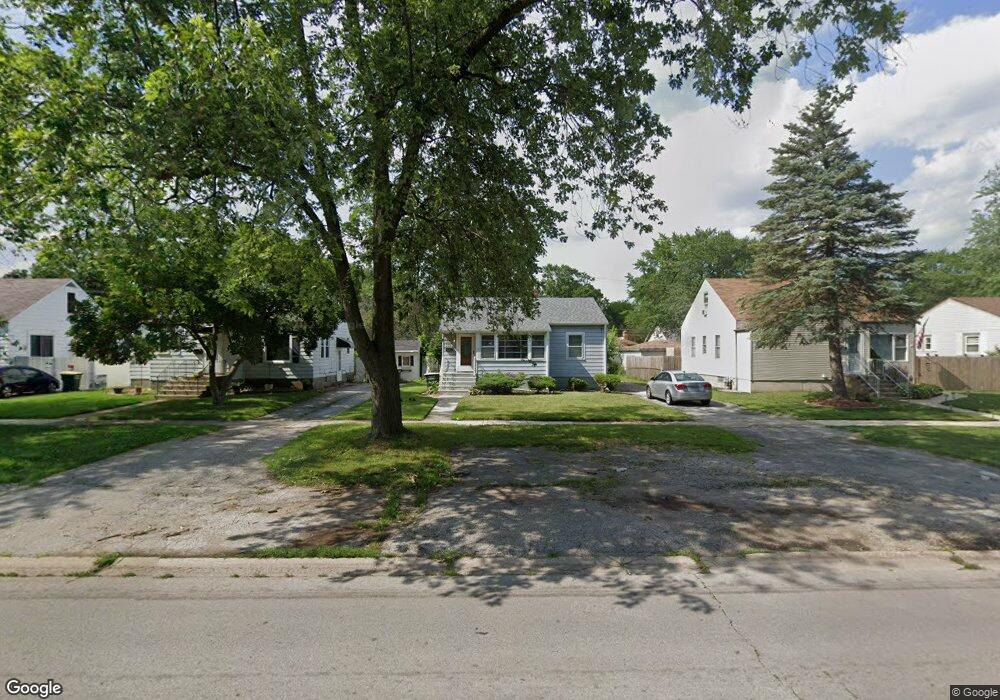
3418 186th St Lansing, IL 60438
Estimated Value: $172,982 - $215,000
3
Beds
2
Baths
855
Sq Ft
$228/Sq Ft
Est. Value
About This Home
This home is located at 3418 186th St, Lansing, IL 60438 and is currently estimated at $194,996, approximately $228 per square foot. 3418 186th St is a home located in Cook County with nearby schools including Coolidge Elementary School, Memorial Jr High School, and Thornton Fractnl So High School.
Ownership History
Date
Name
Owned For
Owner Type
Purchase Details
Closed on
Sep 19, 2005
Sold by
Fisher Gregory T and Fisher Elizabeth A
Bought by
Brumfield Darren T and Brumfield Dorian
Current Estimated Value
Home Financials for this Owner
Home Financials are based on the most recent Mortgage that was taken out on this home.
Original Mortgage
$120,000
Outstanding Balance
$71,376
Interest Rate
8%
Mortgage Type
Unknown
Estimated Equity
$123,620
Purchase Details
Closed on
Nov 23, 1993
Sold by
Goodrich Herman R and Goodrich Joyce L
Bought by
Fisher Gregory T and Fisher Elizabeth A
Home Financials for this Owner
Home Financials are based on the most recent Mortgage that was taken out on this home.
Original Mortgage
$70,452
Interest Rate
6.88%
Mortgage Type
FHA
Create a Home Valuation Report for This Property
The Home Valuation Report is an in-depth analysis detailing your home's value as well as a comparison with similar homes in the area
Home Values in the Area
Average Home Value in this Area
Purchase History
| Date | Buyer | Sale Price | Title Company |
|---|---|---|---|
| Brumfield Darren T | $150,000 | Pntn | |
| Fisher Gregory T | $48,000 | -- |
Source: Public Records
Mortgage History
| Date | Status | Borrower | Loan Amount |
|---|---|---|---|
| Open | Brumfield Darren T | $120,000 | |
| Previous Owner | Fisher Gregory T | $70,452 |
Source: Public Records
Tax History
| Year | Tax Paid | Tax Assessment Tax Assessment Total Assessment is a certain percentage of the fair market value that is determined by local assessors to be the total taxable value of land and additions on the property. | Land | Improvement |
|---|---|---|---|---|
| 2025 | $4,957 | $13,561 | $3,609 | $9,952 |
| 2024 | $4,957 | $13,561 | $3,609 | $9,952 |
| 2023 | $5,059 | $14,000 | $3,609 | $10,391 |
| 2022 | $5,059 | $11,205 | $3,117 | $8,088 |
| 2021 | $4,977 | $11,204 | $3,116 | $8,088 |
| 2020 | $4,753 | $11,204 | $3,116 | $8,088 |
| 2019 | $3,631 | $9,807 | $2,624 | $7,183 |
| 2018 | $3,560 | $9,807 | $2,624 | $7,183 |
| 2017 | $3,629 | $9,807 | $2,624 | $7,183 |
| 2016 | $2,668 | $7,376 | $2,460 | $4,916 |
| 2015 | $2,415 | $7,376 | $2,460 | $4,916 |
| 2014 | $3,146 | $8,847 | $2,460 | $6,387 |
| 2013 | $3,192 | $9,718 | $2,460 | $7,258 |
Source: Public Records
Map
Nearby Homes
- 3310 186th St
- 18644 William St
- 3250 186th St
- 18634 Bernadine St
- 3359 Ann St
- 18747 Sherman St
- 18504 Wentworth Ave
- 3316 Ann St
- 3225 Otto St
- 3620 186th St Unit 405
- 18309 Grant St
- 18275 Ada St
- 18405 Wentworth Ave Unit 1D
- 18315 Burnham Ave Unit 204
- 18443 Maple St
- 18215 Wentworth Ave Unit 3B
- 18855 Burnham Ave Unit 234
- 18358 Willow Ln
- 3240 N Manor Dr Unit 216
- 18263 Greenbay Ave
- 3422 186th St
- 3414 186th St
- 3426 186th St
- 3410 186th St
- 3375 S Schultz Dr
- 3430 186th St
- 3360 186th St
- 3379 S Schultz Dr
- 3371 S Schultz Dr
- 3403 S Schultz Dr
- 3365 S Schultz Dr
- 3438 186th St
- 3407 S Schultz Dr
- 3356 186th St
- 3361 S Schultz Dr
- 3423 186th St
- 3423 186th St
- 3417 186th St
- 3413 186th St
- 3413 186th St
Your Personal Tour Guide
Ask me questions while you tour the home.