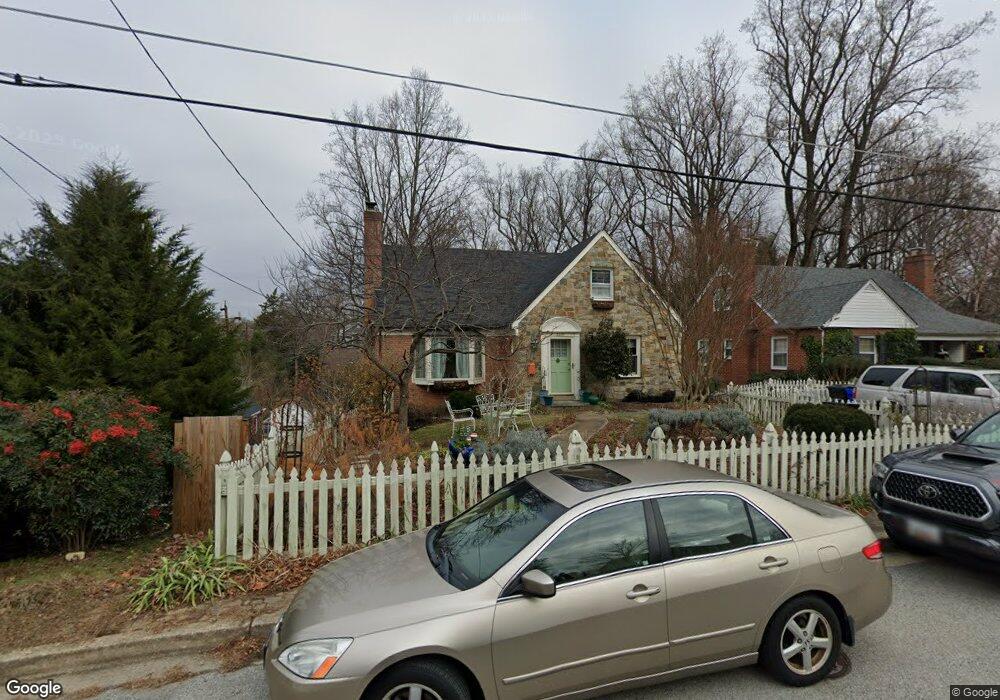
3419 Dupont Ave Kensington, MD 20895
Estimated Value: $750,000 - $969,000
--
Bed
3
Baths
1,886
Sq Ft
$452/Sq Ft
Est. Value
About This Home
This home is located at 3419 Dupont Ave, Kensington, MD 20895 and is currently estimated at $853,375, approximately $452 per square foot. 3419 Dupont Ave is a home located in Montgomery County with nearby schools including Long Lake Elementary School, Mackinaw City School, and Kensington Parkwood Elementary School.
Ownership History
Date
Name
Owned For
Owner Type
Purchase Details
Closed on
Oct 9, 2017
Sold by
Rodgers Margaret Ann and Rodgers James David
Bought by
Rodgers Margaret Ann
Current Estimated Value
Home Financials for this Owner
Home Financials are based on the most recent Mortgage that was taken out on this home.
Original Mortgage
$411,000
Outstanding Balance
$343,301
Interest Rate
3.82%
Mortgage Type
New Conventional
Estimated Equity
$510,074
Purchase Details
Closed on
Jun 20, 2013
Sold by
Stancill Scott D and Rodgers Margaret Ann
Bought by
Rodgers Margaret Ann and Rodgers James David
Home Financials for this Owner
Home Financials are based on the most recent Mortgage that was taken out on this home.
Original Mortgage
$350,000
Interest Rate
3.59%
Mortgage Type
New Conventional
Purchase Details
Closed on
Dec 22, 1997
Sold by
Q Richard and Q Reichard M
Bought by
A Scott D and A Stancill M
Create a Home Valuation Report for This Property
The Home Valuation Report is an in-depth analysis detailing your home's value as well as a comparison with similar homes in the area
Home Values in the Area
Average Home Value in this Area
Purchase History
| Date | Buyer | Sale Price | Title Company |
|---|---|---|---|
| Rodgers Margaret Ann | -- | None Available | |
| Rodgers Margaret Ann | $254,800 | Rsi Title Llc | |
| A Scott D | $205,000 | -- |
Source: Public Records
Mortgage History
| Date | Status | Borrower | Loan Amount |
|---|---|---|---|
| Open | Rodgers Margaret Ann | $411,000 | |
| Previous Owner | Rodgers Margaret Ann | $350,000 |
Source: Public Records
Tax History Compared to Growth
Tax History
| Year | Tax Paid | Tax Assessment Tax Assessment Total Assessment is a certain percentage of the fair market value that is determined by local assessors to be the total taxable value of land and additions on the property. | Land | Improvement |
|---|---|---|---|---|
| 2025 | $11,946 | $850,900 | $244,800 | $606,100 |
| 2024 | $11,946 | $918,400 | $244,800 | $673,600 |
| 2023 | $9,167 | $825,567 | $0 | $0 |
| 2022 | $9,047 | $732,733 | $0 | $0 |
| 2021 | $7,230 | $639,900 | $244,800 | $395,100 |
| 2020 | $4,542 | $638,000 | $0 | $0 |
| 2019 | $4,331 | $636,100 | $0 | $0 |
| 2018 | $7,085 | $634,200 | $244,800 | $389,400 |
| 2017 | $4,160 | $602,500 | $0 | $0 |
| 2016 | -- | $570,800 | $0 | $0 |
| 2015 | $4,614 | $539,100 | $0 | $0 |
| 2014 | $4,614 | $539,100 | $0 | $0 |
Source: Public Records
Map
Nearby Homes
- 3600 Decatur Ave
- 3511 Decatur Ave
- 3603 Plyers Mill Rd
- 10502 Drumm Ave
- 3117 Plyers Mill Rd
- 3421 University Blvd W Unit 3421-302
- 3419 University Blvd W Unit 102
- 3355 University Blvd W Unit 206
- 3014 Jennings Rd
- 10802 Stella Ct
- 3722 Lawrence Ave
- 3333 University Blvd W Unit 1008
- 11006 Madison St
- 3303 Fayette Rd
- 10400 Montgomery Ave
- 3013 Ferndale St
- 3010 Fayette Rd
- 10305 Armory Ave
- 3419 Wake Dr
- 10212 Montgomery Ave Unit 9
- 3417 Dupont Ave
- 10701 Saint Paul St
- 3415 Dupont Ave
- 10707 Saint Paul St
- 10616 Wheatley St
- 3414 Dupont Ave
- 3413 Dupont Ave
- 10615 Saint Paul St
- 3501 Dupont Ave
- 10704 Saint Paul St
- 10619 Wheatley St
- 10614 Wheatley St
- 3414 Farragut Ave
- 3412 Farragut Ave
- 10613 Saint Paul St
- 3500 Farragut Ave
- 3503 Dupont Ave
- 3410 Farragut Ave
- 10617 Wheatley St
- 10612 Wheatley St