3419 Johnson Ferry Rd NE Roswell, GA 30075
East Cobb NeighborhoodEstimated Value: $652,000 - $716,000
4
Beds
4
Baths
3,010
Sq Ft
$228/Sq Ft
Est. Value
About This Home
This home is located at 3419 Johnson Ferry Rd NE, Roswell, GA 30075 and is currently estimated at $686,726, approximately $228 per square foot. 3419 Johnson Ferry Rd NE is a home located in Cobb County with nearby schools including Shallowford Falls Elementary School, Simpson Middle School, and Lassiter High School.
Ownership History
Date
Name
Owned For
Owner Type
Purchase Details
Closed on
May 3, 2019
Sold by
Cruz Ramon
Bought by
Cruz Ramon and Abirasniette Sofia D
Current Estimated Value
Home Financials for this Owner
Home Financials are based on the most recent Mortgage that was taken out on this home.
Original Mortgage
$391,737
Outstanding Balance
$342,283
Interest Rate
4%
Mortgage Type
New Conventional
Estimated Equity
$344,443
Purchase Details
Closed on
Feb 28, 2006
Sold by
Gibbons Joseph J and Gibbons Elizabeth A
Bought by
Duhart Walter K and Duhart Danita C
Home Financials for this Owner
Home Financials are based on the most recent Mortgage that was taken out on this home.
Original Mortgage
$281,000
Interest Rate
6.04%
Mortgage Type
New Conventional
Create a Home Valuation Report for This Property
The Home Valuation Report is an in-depth analysis detailing your home's value as well as a comparison with similar homes in the area
Home Values in the Area
Average Home Value in this Area
Purchase History
| Date | Buyer | Sale Price | Title Company |
|---|---|---|---|
| Cruz Ramon | -- | -- | |
| Cruz Ramon | $385,000 | -- | |
| Duhart Walter K | -- | -- | |
| Duhart Walter K | $351,300 | -- |
Source: Public Records
Mortgage History
| Date | Status | Borrower | Loan Amount |
|---|---|---|---|
| Open | Cruz Ramon | $391,737 | |
| Closed | Cruz Ramon | $391,737 | |
| Previous Owner | Duhart Walter K | $281,000 |
Source: Public Records
Tax History Compared to Growth
Tax History
| Year | Tax Paid | Tax Assessment Tax Assessment Total Assessment is a certain percentage of the fair market value that is determined by local assessors to be the total taxable value of land and additions on the property. | Land | Improvement |
|---|---|---|---|---|
| 2025 | $6,319 | $248,020 | $52,000 | $196,020 |
| 2024 | $6,324 | $248,020 | $52,000 | $196,020 |
| 2023 | $5,046 | $214,120 | $39,200 | $174,920 |
| 2022 | $5,630 | $214,120 | $39,200 | $174,920 |
| 2021 | $4,314 | $154,000 | $35,840 | $118,160 |
| 2020 | $4,314 | $154,000 | $35,840 | $118,160 |
| 2019 | $3,793 | $143,784 | $36,800 | $106,984 |
| 2018 | $3,973 | $152,028 | $34,800 | $117,228 |
| 2017 | $3,821 | $152,028 | $34,800 | $117,228 |
| 2016 | $3,236 | $125,312 | $34,800 | $90,512 |
| 2015 | $3,087 | $115,228 | $32,000 | $83,228 |
| 2014 | $3,113 | $115,228 | $0 | $0 |
Source: Public Records
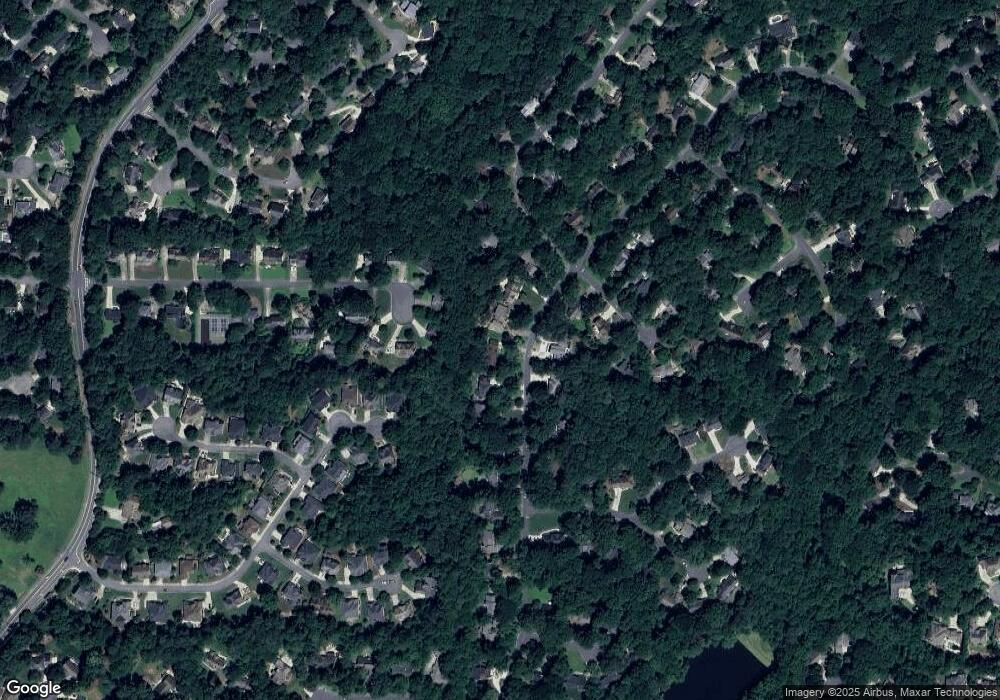
Map
Nearby Homes
- 3402 Johnson Ferry Rd NE
- 4319 Summit Oaks Ln NE
- 4220 Singing Post Ln NE
- 3453 Drayton Dr NE
- 4505 Bastion Dr
- 4509 Bastion Dr
- 3760 Loch Highland Pkwy NE
- 4146 Chimney Lake Dr NE
- 4680 Cambridge Approach Cir NE
- 4520 Huntridge Dr NE
- 3865 Mabry Rd NE
- 3645 Lassiter Rd
- 3810 Galloway Dr NE
- 4149 Barberry Dr NE
- 4150 Chimney Heights NE
- 3277 Artessa Ln NE
- 4645 Shallowford Rd
- 3417 Johnson Ferry Rd NE
- 3421 Johnson Ferry Rd NE
- 4242 Singing Post Ln NE
- 3415 Johnson Ferry Rd NE
- 3423 Johnson Ferry Rd NE
- 3416 Johnson Ferry Rd NE
- 4245 Singing Post Ln NE Unit 5
- 3414 Johnson Ferry Rd NE
- 4240 Singing Post Ln NE
- 3413 Johnson Ferry Rd NE
- 4350 N Smoke Ridge Ct NE
- 4354 S Smoke Ridge Ct NE
- 3657 Summit Oaks Dr NE
- 4346 N Smoke Ridge Ct NE
- 3412 Johnson Ferry Rd NE
- 4238 Singing Post Ln NE Unit 5
- 4358 S Smoke Ridge Ct NE
- 3653 Summit Oaks Dr NE
- S S Smoke Ridge Ct NE
- 3411 Johnson Ferry Rd NE