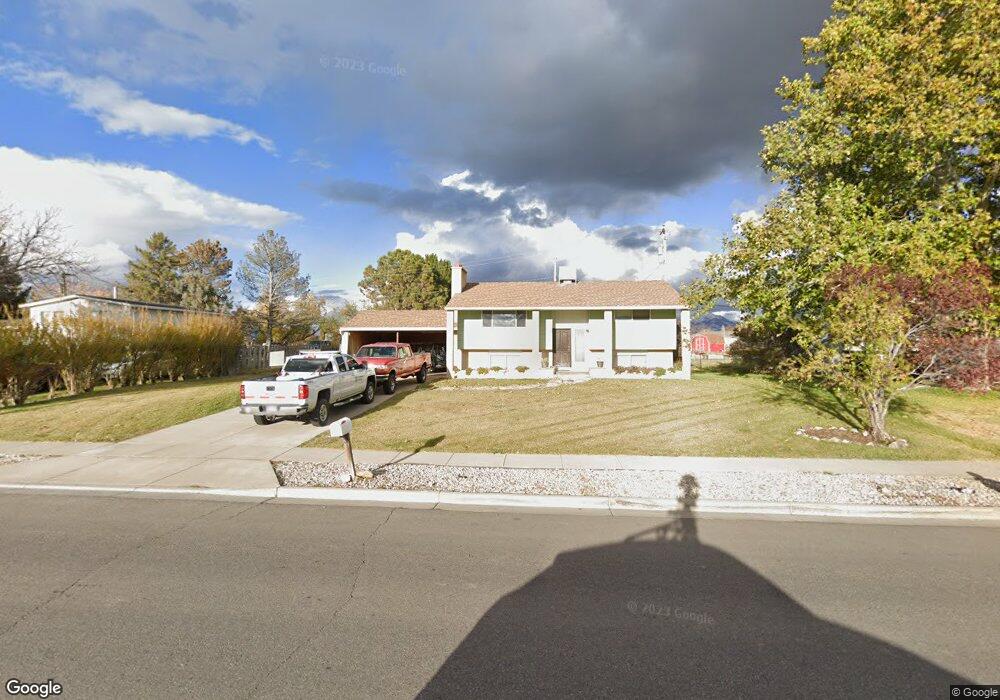
3419 S Bluff Rd Syracuse, UT 84075
Estimated Value: $466,000 - $584,000
4
Beds
2
Baths
1,970
Sq Ft
$261/Sq Ft
Est. Value
About This Home
This home is located at 3419 S Bluff Rd, Syracuse, UT 84075 and is currently estimated at $514,723, approximately $261 per square foot. 3419 S Bluff Rd is a home located in Davis County with nearby schools including Bluff Ridge Elementary, Legacy Junior High School, and Clearfield High School.
Ownership History
Date
Name
Owned For
Owner Type
Purchase Details
Closed on
Aug 2, 2021
Sold by
Irvine Justin and Irvine Rebecca
Bought by
Cook Karson Leo
Current Estimated Value
Home Financials for this Owner
Home Financials are based on the most recent Mortgage that was taken out on this home.
Original Mortgage
$368,600
Outstanding Balance
$334,601
Interest Rate
2.93%
Mortgage Type
New Conventional
Estimated Equity
$180,122
Purchase Details
Closed on
Mar 10, 2010
Sold by
Irvine Justin
Bought by
Irvine Justin and Irvine Rebecca
Home Financials for this Owner
Home Financials are based on the most recent Mortgage that was taken out on this home.
Original Mortgage
$133,600
Interest Rate
4.93%
Mortgage Type
New Conventional
Purchase Details
Closed on
Oct 27, 2008
Sold by
Etherington Colleen and Etherington Colleen M
Bought by
The Trust Of Colleen M Etherington and Etherington Colleen M
Create a Home Valuation Report for This Property
The Home Valuation Report is an in-depth analysis detailing your home's value as well as a comparison with similar homes in the area
Home Values in the Area
Average Home Value in this Area
Purchase History
| Date | Buyer | Sale Price | Title Company |
|---|---|---|---|
| Cook Karson Leo | -- | Rudd & Hawkes Ttl Ins Agcy L | |
| Irvine Justin | -- | United Title Services Of Ut | |
| Irvine Justin | -- | Cornerstone Title Ins | |
| The Trust Of Colleen M Etherington | -- | None Available |
Source: Public Records
Mortgage History
| Date | Status | Borrower | Loan Amount |
|---|---|---|---|
| Open | Cook Karson Leo | $368,600 | |
| Previous Owner | Irvine Justin | $133,600 |
Source: Public Records
Tax History
| Year | Tax Paid | Tax Assessment Tax Assessment Total Assessment is a certain percentage of the fair market value that is determined by local assessors to be the total taxable value of land and additions on the property. | Land | Improvement |
|---|---|---|---|---|
| 2025 | $2,320 | $223,851 | $128,926 | $94,925 |
| 2024 | $2,378 | $231,000 | $138,615 | $92,385 |
| 2023 | $2,215 | $392,000 | $191,901 | $200,099 |
| 2022 | $2,358 | $228,800 | $107,536 | $121,264 |
| 2021 | $3,946 | $326,000 | $161,325 | $164,675 |
| 2020 | $1,905 | $277,000 | $130,203 | $146,797 |
| 2019 | $1,818 | $261,000 | $137,323 | $123,677 |
| 2018 | $1,649 | $235,000 | $119,449 | $115,551 |
| 2016 | $1,370 | $102,410 | $48,014 | $54,396 |
| 2015 | $1,269 | $90,310 | $48,014 | $42,296 |
| 2014 | $1,362 | $98,807 | $48,014 | $50,793 |
| 2013 | -- | $80,742 | $40,664 | $40,078 |
Source: Public Records
Map
Nearby Homes
- 3506 S Kite St
- 3528 S Finch St
- 3570 S Creek Side Ln
- 3067 S Old Emigrant Rd Unit B
- 2987 S Old Emigrant Rd Unit A
- 3047 S Old Emigrant Rd
- 1282 W 3150 S
- 3488 S Sugar Pine Dr
- 2955 S 1375 W
- 3448 S 550 W
- 1651 W White Pine Dr
- 1661 W Ross Rd
- 3074 S Edgewater Ln
- 921 W 2700 S
- 34 S 3600 W
- 1664 2975 S Unit B
- 3502 S Poplar Ln
- 1694 2975 S Unit D
- 2968 Old Emigrant Rd
- 1874 W Parkview Dr
- 3409 S Bluff Rd
- 3429 S Bluff Rd
- 3443 S Bluff Rd
- 3395 S Bluff Rd
- 3451 S Bluff Rd
- 3385 S Bluff Rd
- 3384 S 1000 W
- 3461 S Bluff Rd
- 3375 S Bluff Rd
- 3406 S 1000 W
- 3361 S Bluff Dr
- 3355 S Bluff Dr
- 3363 S Bluff Rd
- 3349 S Bluff Dr
- 3381 S 1000 W
- 3407 S 1000 W
- 3357 S 1000 W
- 3409 S 1000 W
- 3343 S Bluff Rd
- 3333 S 1000 W
Your Personal Tour Guide
Ask me questions while you tour the home.