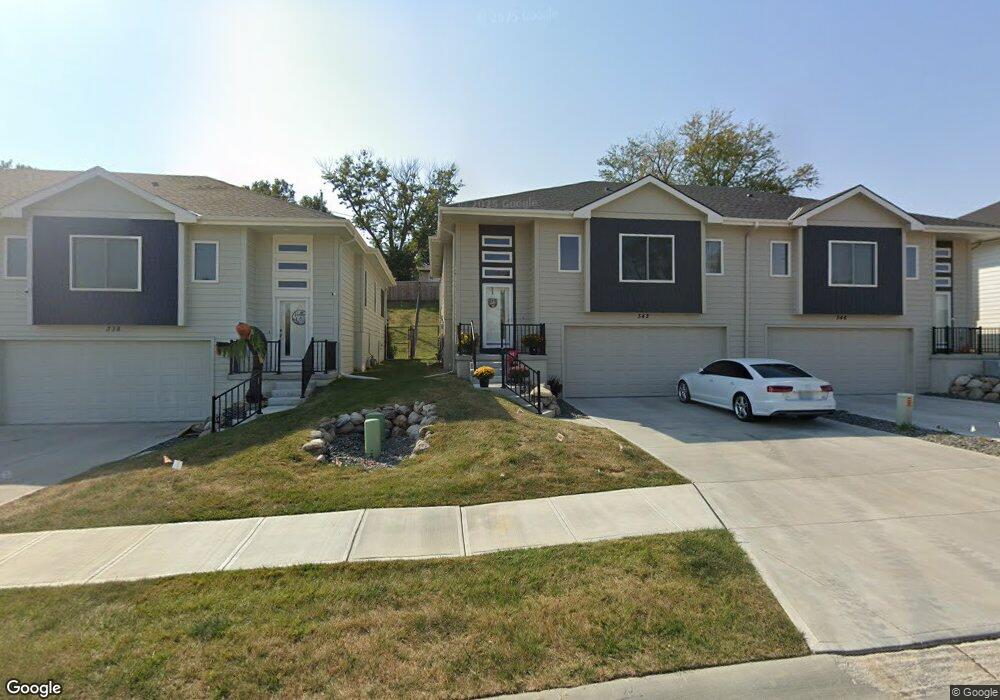
342-346 N Allen St Bennington, NE 68007
Estimated Value: $279,000 - $324,863
3
Beds
3
Baths
1,196
Sq Ft
$255/Sq Ft
Est. Value
About This Home
This home is located at 342-346 N Allen St, Bennington, NE 68007 and is currently estimated at $304,966, approximately $254 per square foot. 342-346 N Allen St is a home located in Douglas County with nearby schools including Bennington High School, Legacy School, and Concordia Junior/Senior High School.
Ownership History
Date
Name
Owned For
Owner Type
Purchase Details
Closed on
Aug 11, 2022
Sold by
Seeing Double Llc
Bought by
Ossenkop Investments Llc
Current Estimated Value
Home Financials for this Owner
Home Financials are based on the most recent Mortgage that was taken out on this home.
Original Mortgage
$243,507
Outstanding Balance
$232,490
Interest Rate
5.51%
Mortgage Type
New Conventional
Estimated Equity
$72,476
Purchase Details
Closed on
Nov 25, 2019
Sold by
Smart Development Llc
Bought by
Seeing Double Llc
Home Financials for this Owner
Home Financials are based on the most recent Mortgage that was taken out on this home.
Original Mortgage
$179,550
Interest Rate
2.9%
Mortgage Type
Commercial
Create a Home Valuation Report for This Property
The Home Valuation Report is an in-depth analysis detailing your home's value as well as a comparison with similar homes in the area
Home Values in the Area
Average Home Value in this Area
Purchase History
| Date | Buyer | Sale Price | Title Company |
|---|---|---|---|
| Ossenkop Investments Llc | -- | Midwest Title | |
| Ossenkop Investments Llc | -- | Midwest Title | |
| Seeing Double Llc | $40,000 | Ambassador Title Services | |
| Seeing Double Llc | $40,000 | Ambassador Title Services |
Source: Public Records
Mortgage History
| Date | Status | Borrower | Loan Amount |
|---|---|---|---|
| Open | Ossenkop Investments Llc | $243,507 | |
| Previous Owner | Seeing Double Llc | $179,550 |
Source: Public Records
Tax History Compared to Growth
Tax History
| Year | Tax Paid | Tax Assessment Tax Assessment Total Assessment is a certain percentage of the fair market value that is determined by local assessors to be the total taxable value of land and additions on the property. | Land | Improvement |
|---|---|---|---|---|
| 2025 | $5,658 | $286,900 | $27,400 | $259,500 |
| 2024 | $5,465 | $286,900 | $27,400 | $259,500 |
| 2023 | $5,465 | $234,800 | $27,400 | $207,400 |
| 2022 | $2,374 | $96,500 | $27,400 | $69,100 |
| 2021 | $688 | $27,400 | $27,400 | $0 |
| 2020 | $76 | $3,000 | $3,000 | $0 |
| 2019 | $77 | $6,000 | $6,000 | $0 |
Source: Public Records
Map
Nearby Homes
- 15610 Howard Ln
- 202 N Molley St
- 12014 N 156th Ave
- 14804 Willow St
- Austin PV Plan at Stratford West
- Weston Plan at Stratford West
- Del Ray Plan at Stratford West
- Kendall Plan at Stratford West
- Grayson EXP Plan at Stratford West
- Cascade Plan at Stratford West
- Carlton PV Plan at Stratford West
- Jordan Plan at Stratford West
- Rocklin Plan at Stratford West
- Sheridan EXP Plan at Stratford West
- Grayson Plan at Stratford West
- Vista PV Plan at Stratford West
- Concord Plan at Stratford West
- Sheridan Plan at Stratford West
- Santee Exp Plan at Stratford West
- Concord Exp Plan at Stratford West