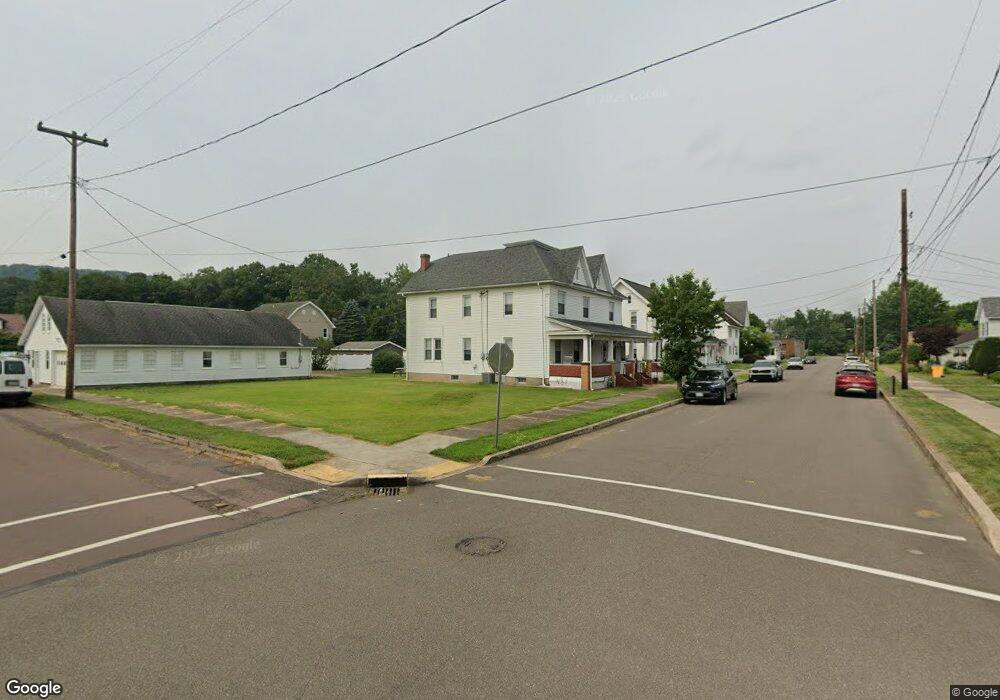
342 4th St Nescopeck, PA 18635
Estimated Value: $183,482 - $282,000
Studio
--
Bath
3,986
Sq Ft
$55/Sq Ft
Est. Value
About This Home
This home is located at 342 4th St, Nescopeck, PA 18635 and is currently estimated at $220,621, approximately $55 per square foot. 342 4th St is a home located in Luzerne County with nearby schools including Berwick Area High School, Holy Family Consolidated School, and New Story School.
Ownership History
Date
Name
Owned For
Owner Type
Purchase Details
Closed on
Mar 12, 2024
Sold by
Robert E Bull And Sara E Bull Revocable
Bought by
J Walsh Development Llc
Current Estimated Value
Home Financials for this Owner
Home Financials are based on the most recent Mortgage that was taken out on this home.
Original Mortgage
$211,000
Outstanding Balance
$206,662
Interest Rate
6.63%
Mortgage Type
Construction
Estimated Equity
$13,959
Purchase Details
Closed on
Nov 7, 2019
Sold by
Bull Robert E and Estate Of Starrling O Bull
Bought by
Bull Robert E
Purchase Details
Closed on
Jan 12, 1991
Bought by
Bull Starrling
Create a Home Valuation Report for This Property
The Home Valuation Report is an in-depth analysis detailing your home's value as well as a comparison with similar homes in the area
Home Values in the Area
Average Home Value in this Area
Purchase History
| Date | Buyer | Sale Price | Title Company |
|---|---|---|---|
| J Walsh Development Llc | $220,000 | None Listed On Document | |
| J Walsh Development Llc | $220,000 | None Listed On Document | |
| Bull Robert E | -- | None Available | |
| Bull Robert E | -- | None Available | |
| Bull Starrling | -- | -- | |
| Bull Starrling | -- | -- |
Source: Public Records
Mortgage History
| Date | Status | Borrower | Loan Amount |
|---|---|---|---|
| Open | J Walsh Development Llc | $211,000 |
Source: Public Records
Tax History
| Year | Tax Paid | Tax Assessment Tax Assessment Total Assessment is a certain percentage of the fair market value that is determined by local assessors to be the total taxable value of land and additions on the property. | Land | Improvement |
|---|---|---|---|---|
| 2025 | $2,247 | $100,000 | $21,100 | $78,900 |
| 2024 | $2,179 | $100,000 | $21,100 | $78,900 |
| 2023 | $2,092 | $100,000 | $21,100 | $78,900 |
| 2022 | $2,074 | $100,000 | $21,100 | $78,900 |
| 2021 | $1,914 | $100,000 | $21,100 | $78,900 |
| 2020 | $1,856 | $100,000 | $21,100 | $78,900 |
| 2019 | $1,843 | $100,000 | $21,100 | $78,900 |
| 2018 | $1,830 | $100,000 | $21,100 | $78,900 |
| 2017 | $1,902 | $100,000 | $21,100 | $78,900 |
| 2016 | -- | $100,000 | $21,100 | $78,900 |
| 2015 | -- | $100,000 | $21,100 | $78,900 |
| 2014 | -- | $100,000 | $21,100 | $78,900 |
Source: Public Records
Map
Nearby Homes
Your Personal Tour Guide
Ask me questions while you tour the home.