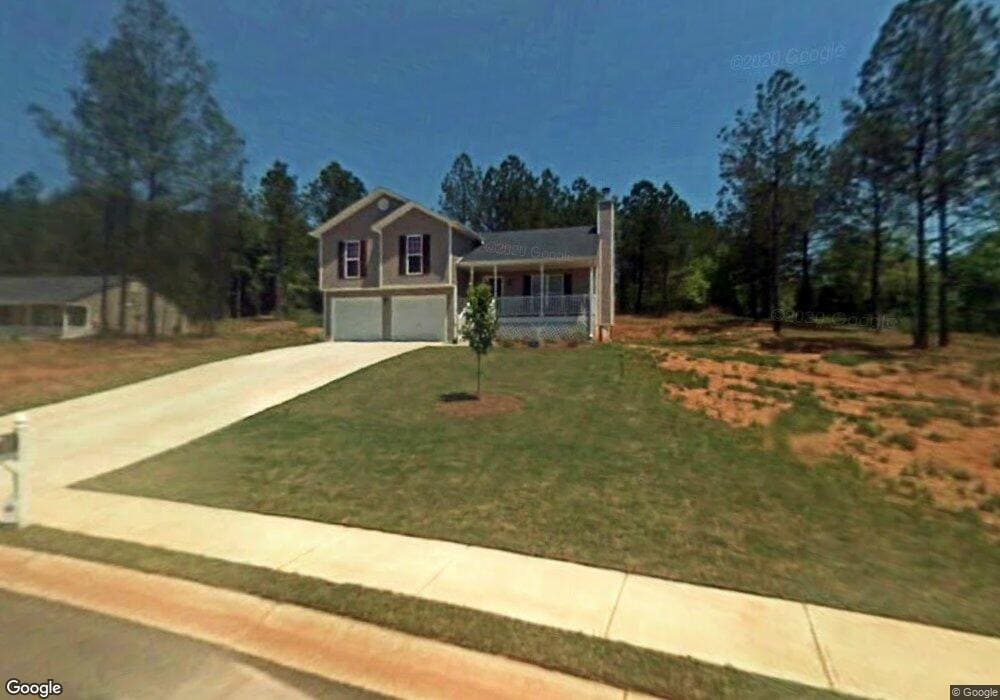
342 Centennial Dr Unit 1 Bethlehem, GA 30620
Estimated Value: $313,699 - $341,000
3
Beds
3
Baths
1,783
Sq Ft
$186/Sq Ft
Est. Value
About This Home
This home is located at 342 Centennial Dr Unit 1, Bethlehem, GA 30620 and is currently estimated at $331,925, approximately $186 per square foot. 342 Centennial Dr Unit 1 is a home located in Barrow County with nearby schools including Bethlehem Elementary School, Haymon-Morris Middle School, and Apalachee High School.
Ownership History
Date
Name
Owned For
Owner Type
Purchase Details
Closed on
Jun 20, 2013
Sold by
Secretary Of Housing And U
Bought by
Mong Vo Hong Thanh
Current Estimated Value
Purchase Details
Closed on
Feb 7, 2013
Sold by
Jpmorgan Chase Bank Nation
Bought by
Secretary Of Housing And Urban
Purchase Details
Closed on
Feb 7, 2012
Sold by
Young Zachariah
Bought by
Jpmorgan Chase Bank National A
Purchase Details
Closed on
Jun 15, 2007
Sold by
Southfork Hms Inc
Bought by
Young Zachariah and Young Stacy
Home Financials for this Owner
Home Financials are based on the most recent Mortgage that was taken out on this home.
Original Mortgage
$145,500
Interest Rate
6.12%
Mortgage Type
FHA
Purchase Details
Closed on
Nov 22, 2006
Sold by
Ansley Estates Llc
Bought by
Southfork Homes Inc
Purchase Details
Closed on
May 12, 2005
Sold by
See Sellers In Comments
Bought by
Ansley Estates Llc
Create a Home Valuation Report for This Property
The Home Valuation Report is an in-depth analysis detailing your home's value as well as a comparison with similar homes in the area
Home Values in the Area
Average Home Value in this Area
Purchase History
| Date | Buyer | Sale Price | Title Company |
|---|---|---|---|
| Mong Vo Hong Thanh | -- | -- | |
| Secretary Of Housing And Urban | -- | -- | |
| Jpmorgan Chase Bank National A | -- | -- | |
| Young Zachariah | $147,800 | -- | |
| Southfork Homes Inc | $36,500 | -- | |
| Ansley Estates Llc | -- | -- |
Source: Public Records
Mortgage History
| Date | Status | Borrower | Loan Amount |
|---|---|---|---|
| Previous Owner | Young Zachariah | $145,500 |
Source: Public Records
Tax History
| Year | Tax Paid | Tax Assessment Tax Assessment Total Assessment is a certain percentage of the fair market value that is determined by local assessors to be the total taxable value of land and additions on the property. | Land | Improvement |
|---|---|---|---|---|
| 2025 | $2,899 | $120,292 | $22,800 | $97,492 |
| 2024 | $2,955 | $117,397 | $22,800 | $94,597 |
| 2023 | $2,955 | $117,797 | $22,800 | $94,997 |
| 2022 | $2,662 | $91,020 | $22,800 | $68,220 |
| 2021 | $2,156 | $68,906 | $16,000 | $52,906 |
| 2020 | $2,094 | $66,718 | $16,000 | $50,718 |
| 2019 | $2,131 | $66,718 | $16,000 | $50,718 |
| 2018 | $2,048 | $64,706 | $11,800 | $52,906 |
| 2017 | $1,544 | $53,044 | $11,800 | $41,244 |
| 2016 | $1,424 | $44,607 | $11,800 | $32,807 |
| 2015 | $1,441 | $44,955 | $11,800 | $33,155 |
| 2014 | $1,353 | $40,658 | $7,154 | $33,504 |
| 2013 | -- | $38,189 | $7,154 | $31,035 |
Source: Public Records
Map
Nearby Homes
- 154 Blissful Ln
- 480 Raider Way
- 476 Tanners Bridge Cir Unit 1
- 0 Tanners Bridge Cir Unit 10536031
- 457 Tanners Bridge Cir Unit 4
- 461 Tanners Bridge Cir Unit 3
- 3243 Lowell Rd
- 3153 Lowell Rd
- 3233 Lowell Rd
- 3283 Lowell Rd
- 404 Tanners Bridge Rd
- 1071 Covenant Ct
- 454 Grant Ct
- 453 Tanners Bridge Rd Unit 5
- 763 Moss Side Dr
- 3680 Apalachee Ridge
- 431 Providence Club Dr
- 100 Tanners Bridge Rd
- 410 Providence Club Dr
- 3757 Lower Tanners Bridge Rd
- 342 Centennial Dr
- 344 Centennial Dr
- 341 Centennial Dr
- 340 Centennial Dr Unit 1
- 340 Centennial Dr
- 345 Centennial Dr
- 339 Centennial Dr
- 339 Centennial Dr Unit 1
- 338 Centennial Dr Unit 1
- 338 Centennial Dr
- 338 Centennial Dr
- 338
- 346 Centennial Dr
- 345 Centennial Drive (Lot18)
- 339 Centennial Drive (Lot16)
- 337 Centennial Dr Unit 15
- 337 Centennial Dr
- 337 Centennial Dr Unit 1
- 336 Centennial Dr Unit 1
- 336 Centennial Dr
Your Personal Tour Guide
Ask me questions while you tour the home.