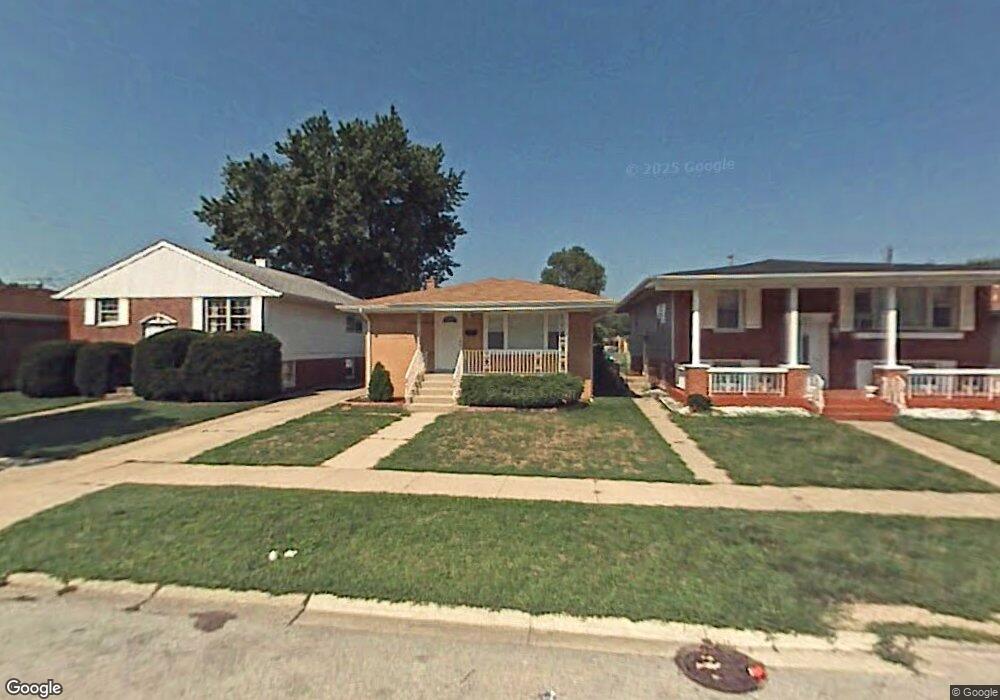
342 Chappel Ave Calumet City, IL 60409
Estimated Value: $191,000 - $272,000
3
Beds
2
Baths
1,300
Sq Ft
$165/Sq Ft
Est. Value
About This Home
This home is located at 342 Chappel Ave, Calumet City, IL 60409 and is currently estimated at $214,694, approximately $165 per square foot. 342 Chappel Ave is a home located in Cook County with nearby schools including Caroline Sibley Elementary School, Creative Communications Academy, and School Of Fine Arts Academy.
Ownership History
Date
Name
Owned For
Owner Type
Purchase Details
Closed on
Jan 18, 2022
Sold by
Torrence Priscilla and Torrence Y
Bought by
The Priscilla Annette Torrence Revocable
Current Estimated Value
Purchase Details
Closed on
Oct 3, 2021
Sold by
Torrence Priscilla and Torrence Y
Bought by
The Priscilla Annette Torrence Revocable
Purchase Details
Closed on
Nov 27, 2006
Sold by
Humble Tiffani
Bought by
Torrence Priscilla
Home Financials for this Owner
Home Financials are based on the most recent Mortgage that was taken out on this home.
Original Mortgage
$172,000
Interest Rate
6.47%
Mortgage Type
Unknown
Purchase Details
Closed on
Sep 8, 1998
Sold by
Hud
Bought by
Thomas Gregory M and Barnes Linda
Home Financials for this Owner
Home Financials are based on the most recent Mortgage that was taken out on this home.
Original Mortgage
$68,400
Interest Rate
6.59%
Mortgage Type
Balloon
Create a Home Valuation Report for This Property
The Home Valuation Report is an in-depth analysis detailing your home's value as well as a comparison with similar homes in the area
Home Values in the Area
Average Home Value in this Area
Purchase History
| Date | Buyer | Sale Price | Title Company |
|---|---|---|---|
| The Priscilla Annette Torrence Revocable | -- | -- | |
| The Priscilla Annette Torrence Revocable | -- | -- | |
| The Priscilla Annette Torrence Revocable | -- | -- | |
| Torrence Priscilla | $175,000 | Ticor Title Insurance Compan | |
| Thomas Gregory M | -- | -- |
Source: Public Records
Mortgage History
| Date | Status | Borrower | Loan Amount |
|---|---|---|---|
| Previous Owner | Torrence Priscilla | $172,000 | |
| Previous Owner | Thomas Gregory M | $68,400 |
Source: Public Records
Tax History Compared to Growth
Tax History
| Year | Tax Paid | Tax Assessment Tax Assessment Total Assessment is a certain percentage of the fair market value that is determined by local assessors to be the total taxable value of land and additions on the property. | Land | Improvement |
|---|---|---|---|---|
| 2024 | $7,297 | $15,000 | $2,142 | $12,858 |
| 2023 | $5,991 | $15,000 | $2,142 | $12,858 |
| 2022 | $5,991 | $10,990 | $1,890 | $9,100 |
| 2021 | $5,710 | $10,989 | $1,890 | $9,099 |
| 2020 | $5,361 | $10,989 | $1,890 | $9,099 |
| 2019 | $3,895 | $8,706 | $1,764 | $6,942 |
| 2018 | $3,874 | $8,706 | $1,764 | $6,942 |
| 2017 | $4,222 | $9,367 | $1,764 | $7,603 |
| 2016 | $2,636 | $6,448 | $1,638 | $4,810 |
| 2015 | $2,492 | $6,448 | $1,638 | $4,810 |
| 2014 | $2,047 | $7,631 | $1,638 | $5,993 |
| 2013 | $4,116 | $9,559 | $1,638 | $7,921 |
Source: Public Records
Map
Nearby Homes
- 360 Chappel Ave
- 375 Chappel Ave
- 308 Clyde Ave
- 370 Clyde Ave
- 351 Clyde Ave
- 317 Madison Ave
- 375 Madison Ave
- 383 Clyde Ave
- 363 Prairie Ave
- 294 Madison Ave
- 286 Merrill Ave
- 405 Clyde Ave
- 330 Paxton Ave
- 301 Cornell Ave
- 427 Clyde Ave
- 288 Paxton Ave
- 275 Paxton Ave
- 451 Clyde Ave
- 417 Cornell Ave
- 428 Paxton Ave
- 338 Chappel Ave
- 344 Chappel Ave
- 346 Chappel Ave
- 336 Chappel Ave
- 350 Chappel Ave
- 332 Chappel Ave
- 354 Chappel Ave
- 330 Chappel Ave
- 343 Chappel Ave
- 339 Chappel Ave
- 345 Chappel Ave
- 358 Chappel Ave
- 337 Chappel Ave
- 347 Chappel Ave
- 326 Chappel Ave
- 333 Chappel Ave
- 351 Chappel Ave
- 322 Chappel Ave
- 331 Chappel Ave
- 355 Chappel Ave