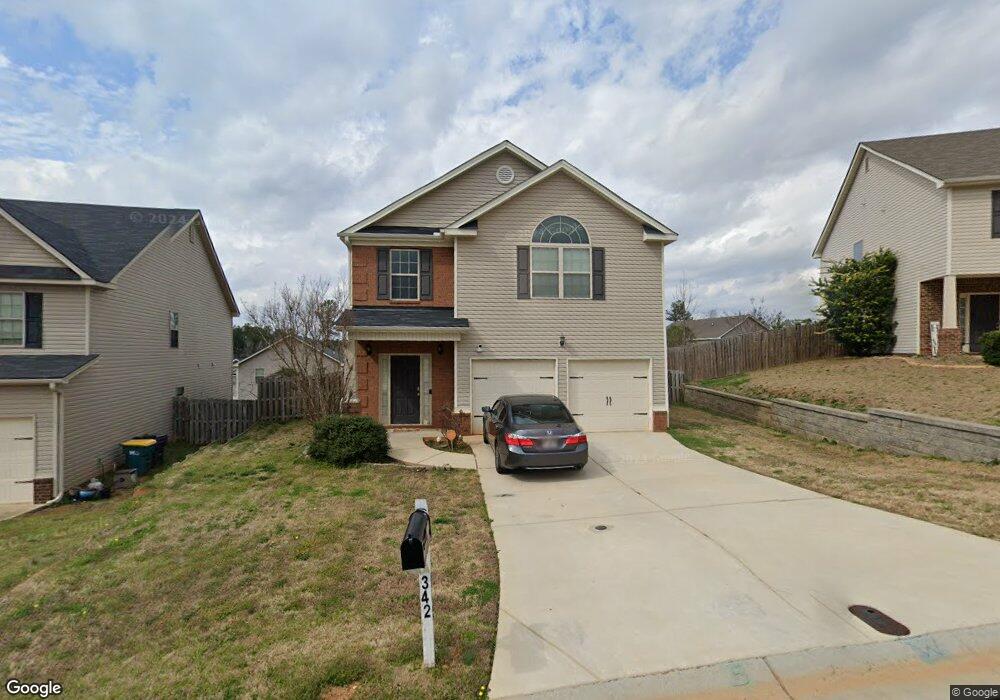
342 Congling Cir Grovetown, GA 30813
Estimated Value: $305,000 - $334,000
4
Beds
3
Baths
2,854
Sq Ft
$110/Sq Ft
Est. Value
About This Home
This home is located at 342 Congling Cir, Grovetown, GA 30813 and is currently estimated at $313,095, approximately $109 per square foot. 342 Congling Cir is a home located in Columbia County with nearby schools including Euchee Creek Elementary School, Grovetown Middle School, and Grovetown High School.
Ownership History
Date
Name
Owned For
Owner Type
Purchase Details
Closed on
Dec 22, 2012
Sold by
Terrell Mark E
Bought by
Terrell Mark E and Terrell Alfreda
Current Estimated Value
Home Financials for this Owner
Home Financials are based on the most recent Mortgage that was taken out on this home.
Original Mortgage
$180,798
Outstanding Balance
$120,018
Interest Rate
2.5%
Mortgage Type
FHA
Estimated Equity
$193,077
Purchase Details
Closed on
Jun 10, 2011
Sold by
Pillon Comm Inc
Bought by
Terrell Mark E
Home Financials for this Owner
Home Financials are based on the most recent Mortgage that was taken out on this home.
Original Mortgage
$174,036
Interest Rate
4.65%
Mortgage Type
VA
Purchase Details
Closed on
May 6, 2011
Sold by
Golzap Llc
Bought by
Pillon Communties Inc
Home Financials for this Owner
Home Financials are based on the most recent Mortgage that was taken out on this home.
Original Mortgage
$174,036
Interest Rate
4.65%
Mortgage Type
VA
Create a Home Valuation Report for This Property
The Home Valuation Report is an in-depth analysis detailing your home's value as well as a comparison with similar homes in the area
Home Values in the Area
Average Home Value in this Area
Purchase History
| Date | Buyer | Sale Price | Title Company |
|---|---|---|---|
| Terrell Mark E | -- | -- | |
| Terrell Mark E | $168,500 | -- | |
| Terrell Mark E | $168,477 | -- | |
| Pillon Communties Inc | $135,000 | -- |
Source: Public Records
Mortgage History
| Date | Status | Borrower | Loan Amount |
|---|---|---|---|
| Open | Terrell Mark E | $180,798 | |
| Previous Owner | Terrell Mark E | $174,036 |
Source: Public Records
Tax History Compared to Growth
Tax History
| Year | Tax Paid | Tax Assessment Tax Assessment Total Assessment is a certain percentage of the fair market value that is determined by local assessors to be the total taxable value of land and additions on the property. | Land | Improvement |
|---|---|---|---|---|
| 2025 | $34 | $123,034 | $18,804 | $104,230 |
| 2024 | $21 | $117,723 | $18,504 | $99,219 |
| 2023 | $2 | $112,828 | $17,904 | $94,924 |
| 2022 | $0 | $95,907 | $15,104 | $80,803 |
| 2021 | $0 | $82,613 | $13,404 | $69,209 |
| 2020 | $2,521 | $80,430 | $12,704 | $67,726 |
| 2019 | $2,521 | $77,722 | $12,304 | $65,418 |
| 2018 | $2,427 | $73,676 | $11,504 | $62,172 |
| 2017 | $2,328 | $72,913 | $11,404 | $61,509 |
| 2016 | $2,269 | $71,451 | $11,180 | $60,271 |
| 2015 | $2,194 | $68,760 | $11,380 | $57,380 |
| 2014 | $2,220 | $68,840 | $10,480 | $58,360 |
Source: Public Records
Map
Nearby Homes