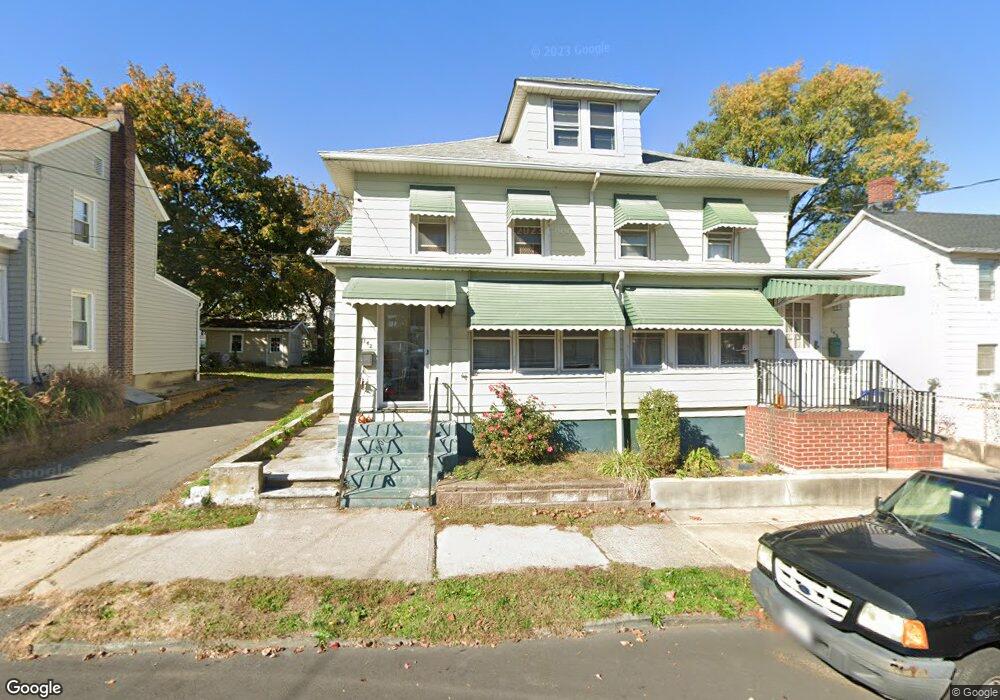
342 David St South Amboy, NJ 08879
Estimated Value: $424,874 - $477,000
--
Bed
--
Bath
1,411
Sq Ft
$318/Sq Ft
Est. Value
About This Home
This home is located at 342 David St, South Amboy, NJ 08879 and is currently estimated at $448,969, approximately $318 per square foot. 342 David St is a home located in Middlesex County with nearby schools including South Amboy Elementary School, South Amboy Middle/High School, and St. Mary Elementary School.
Ownership History
Date
Name
Owned For
Owner Type
Purchase Details
Closed on
Apr 29, 2004
Sold by
Hulsart John W
Bought by
Dorney Michael
Current Estimated Value
Home Financials for this Owner
Home Financials are based on the most recent Mortgage that was taken out on this home.
Original Mortgage
$232,505
Interest Rate
6.32%
Mortgage Type
VA
Purchase Details
Closed on
Nov 12, 1997
Sold by
English Marie
Bought by
Hulsart John and Kedzierski Kim
Home Financials for this Owner
Home Financials are based on the most recent Mortgage that was taken out on this home.
Original Mortgage
$47,000
Interest Rate
7.17%
Create a Home Valuation Report for This Property
The Home Valuation Report is an in-depth analysis detailing your home's value as well as a comparison with similar homes in the area
Home Values in the Area
Average Home Value in this Area
Purchase History
| Date | Buyer | Sale Price | Title Company |
|---|---|---|---|
| Dorney Michael | $227,500 | -- | |
| Hulsart John | $72,000 | -- |
Source: Public Records
Mortgage History
| Date | Status | Borrower | Loan Amount |
|---|---|---|---|
| Previous Owner | Dorney Michael | $232,505 | |
| Previous Owner | Hulsart John | $47,000 |
Source: Public Records
Tax History Compared to Growth
Tax History
| Year | Tax Paid | Tax Assessment Tax Assessment Total Assessment is a certain percentage of the fair market value that is determined by local assessors to be the total taxable value of land and additions on the property. | Land | Improvement |
|---|---|---|---|---|
| 2025 | $7,252 | $226,000 | $111,500 | $114,500 |
| 2024 | $6,979 | $226,000 | $111,500 | $114,500 |
| 2023 | $6,979 | $226,000 | $111,500 | $114,500 |
| 2022 | $6,631 | $226,000 | $111,500 | $114,500 |
| 2021 | $6,520 | $226,000 | $111,500 | $114,500 |
| 2020 | $6,366 | $226,000 | $111,500 | $114,500 |
| 2019 | $6,265 | $226,000 | $111,500 | $114,500 |
| 2018 | $6,213 | $226,000 | $111,500 | $114,500 |
| 2017 | $6,113 | $226,000 | $111,500 | $114,500 |
| 2016 | $5,960 | $226,000 | $111,500 | $114,500 |
| 2015 | $6,003 | $226,000 | $111,500 | $114,500 |
| 2014 | $5,797 | $226,000 | $111,500 | $114,500 |
Source: Public Records
Map
Nearby Homes