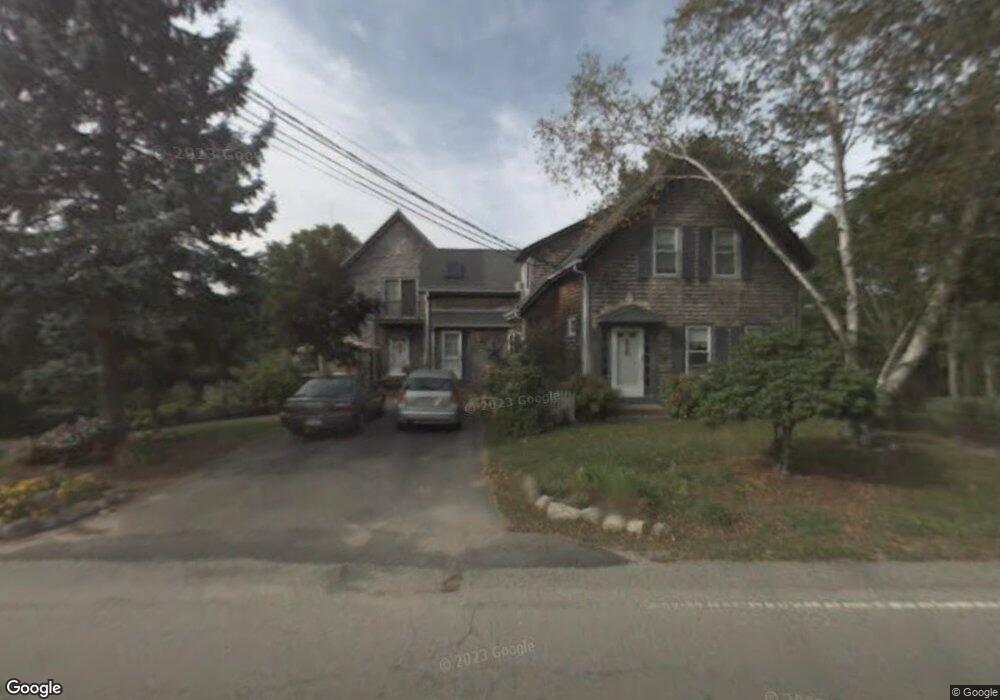
342 High St Whitman, MA 02382
Estimated Value: $661,000 - $860,000
6
Beds
5
Baths
3,663
Sq Ft
$213/Sq Ft
Est. Value
About This Home
This home is located at 342 High St, Whitman, MA 02382 and is currently estimated at $780,266, approximately $213 per square foot. 342 High St is a home located in Plymouth County with nearby schools including St Bridget School and Cardinal Spellman High School.
Ownership History
Date
Name
Owned For
Owner Type
Purchase Details
Closed on
Nov 16, 2021
Sold by
Manning Richard J and Manning Marilynn G
Bought by
T R
Current Estimated Value
Purchase Details
Closed on
May 10, 2002
Sold by
Manning Richard J and Mannins Marilynn G
Bought by
Djustco Inc
Create a Home Valuation Report for This Property
The Home Valuation Report is an in-depth analysis detailing your home's value as well as a comparison with similar homes in the area
Home Values in the Area
Average Home Value in this Area
Purchase History
| Date | Buyer | Sale Price | Title Company |
|---|---|---|---|
| T R | -- | None Available | |
| Djustco Inc | $10,000 | -- |
Source: Public Records
Mortgage History
| Date | Status | Borrower | Loan Amount |
|---|---|---|---|
| Previous Owner | Djustco Inc | $110,000 | |
| Previous Owner | Djustco Inc | $75,000 | |
| Previous Owner | Djustco Inc | $124,000 |
Source: Public Records
Tax History
| Year | Tax Paid | Tax Assessment Tax Assessment Total Assessment is a certain percentage of the fair market value that is determined by local assessors to be the total taxable value of land and additions on the property. | Land | Improvement |
|---|---|---|---|---|
| 2025 | $8,486 | $646,800 | $251,200 | $395,600 |
| 2024 | $7,831 | $614,700 | $245,900 | $368,800 |
| 2023 | $7,480 | $551,200 | $215,500 | $335,700 |
| 2022 | $7,389 | $507,500 | $197,500 | $310,000 |
| 2021 | $7,183 | $463,400 | $182,900 | $280,500 |
| 2020 | $7,052 | $444,900 | $175,000 | $269,900 |
| 2019 | $6,647 | $432,200 | $175,000 | $257,200 |
| 2018 | $6,237 | $389,600 | $166,000 | $223,600 |
| 2017 | $5,875 | $389,600 | $166,000 | $223,600 |
| 2016 | $5,717 | $366,700 | $158,100 | $208,600 |
| 2015 | $5,462 | $349,900 | $141,300 | $208,600 |
Source: Public Records
Map
Nearby Homes
- 360 High St
- 300 High St
- 91 Rice St
- 78 Linda St
- 28 Linda St
- 90 Loring Ave
- 1190 Bedford St Unit G3
- 14 Doris Dr
- 603 Temple St
- 66 Belmont St
- 99 Washington St
- 854 Brockton Ave
- 229 Washington Terrace
- 151 Windsor Dr
- 877 Brockton Ave Unit 877
- 1142 Washington St
- 48 Sullivan Terrace
- 42 Rock St
- 76 Short St
- 22 Eames Ave
Your Personal Tour Guide
Ask me questions while you tour the home.