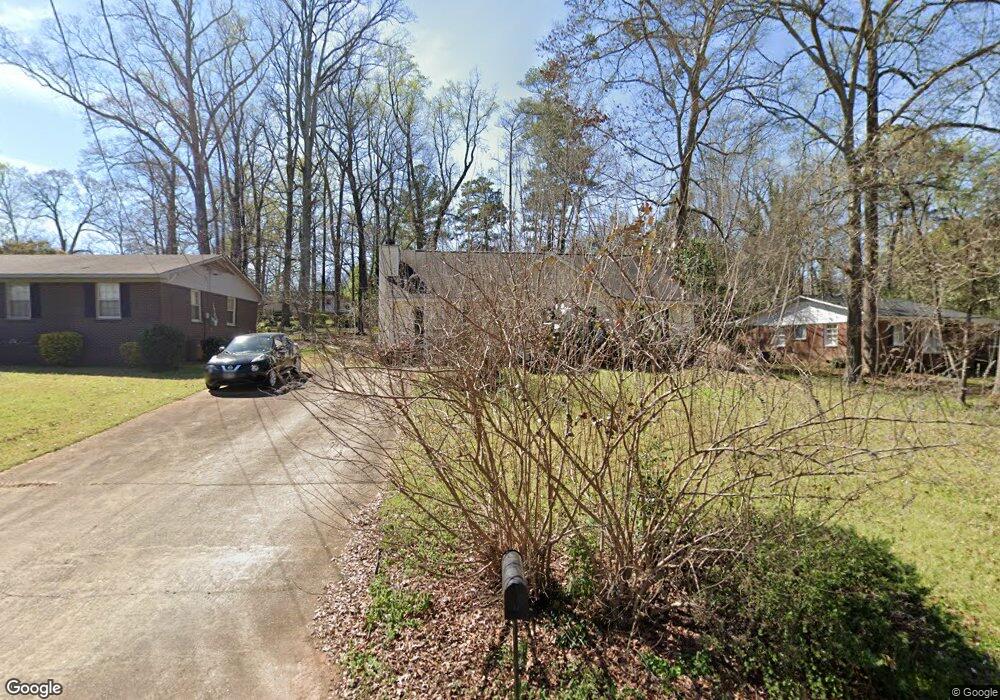
342 Laurel Ln Lagrange, GA 30241
Estimated Value: $190,000 - $228,000
3
Beds
2
Baths
1,290
Sq Ft
$165/Sq Ft
Est. Value
About This Home
This home is located at 342 Laurel Ln, Lagrange, GA 30241 and is currently estimated at $212,231, approximately $164 per square foot. 342 Laurel Ln is a home located in Troup County with nearby schools including Franklin Forest Elementary School, Hollis Hand Elementary School, and Ethel W. Kight Elementary School.
Ownership History
Date
Name
Owned For
Owner Type
Purchase Details
Closed on
May 25, 2010
Sold by
Webb Jackie Lamar
Bought by
Kobayashi Yasuko
Current Estimated Value
Home Financials for this Owner
Home Financials are based on the most recent Mortgage that was taken out on this home.
Original Mortgage
$91,600
Outstanding Balance
$60,533
Interest Rate
5%
Mortgage Type
New Conventional
Estimated Equity
$151,698
Purchase Details
Closed on
Aug 26, 2005
Sold by
Richlan Properties Unlimit
Bought by
Webb Jackie Lamar and Nasworthy Brittany J
Home Financials for this Owner
Home Financials are based on the most recent Mortgage that was taken out on this home.
Original Mortgage
$106,331
Interest Rate
5.77%
Mortgage Type
FHA
Purchase Details
Closed on
Nov 1, 2001
Sold by
Suntrust Bank
Bought by
Richland Properties Unlimited
Purchase Details
Closed on
Sep 13, 2001
Sold by
Mark James
Bought by
Suntrust Bank
Purchase Details
Closed on
May 29, 2001
Sold by
Edith E Calnan
Bought by
Mark James
Create a Home Valuation Report for This Property
The Home Valuation Report is an in-depth analysis detailing your home's value as well as a comparison with similar homes in the area
Purchase History
| Date | Buyer | Sale Price | Title Company |
|---|---|---|---|
| Kobayashi Yasuko | $114,500 | -- | |
| Webb Jackie Lamar | $108,000 | -- | |
| Richland Properties Unlimited | $13,000 | -- | |
| Suntrust Bank | -- | -- | |
| Mark James | $12,000 | -- |
Source: Public Records
Mortgage History
| Date | Status | Borrower | Loan Amount |
|---|---|---|---|
| Open | Kobayashi Yasuko | $91,600 | |
| Previous Owner | Webb Jackie Lamar | $106,331 |
Source: Public Records
Tax History
| Year | Tax Paid | Tax Assessment Tax Assessment Total Assessment is a certain percentage of the fair market value that is determined by local assessors to be the total taxable value of land and additions on the property. | Land | Improvement |
|---|---|---|---|---|
| 2025 | $1,445 | $62,748 | $10,000 | $52,748 |
| 2024 | $1,445 | $53,000 | $10,000 | $43,000 |
| 2023 | $1,341 | $49,160 | $10,000 | $39,160 |
| 2022 | $1,316 | $47,160 | $10,000 | $37,160 |
| 2021 | $1,204 | $39,920 | $8,000 | $31,920 |
| 2020 | $1,204 | $39,920 | $8,000 | $31,920 |
| 2019 | $1,036 | $34,360 | $5,600 | $28,760 |
| 2018 | $1,036 | $34,360 | $5,600 | $28,760 |
| 2017 | $1,036 | $34,360 | $5,600 | $28,760 |
| 2016 | $1,023 | $33,914 | $5,600 | $28,314 |
| 2015 | $956 | $31,641 | $4,800 | $26,841 |
| 2014 | $915 | $30,229 | $4,800 | $25,429 |
| 2013 | -- | $32,205 | $4,800 | $27,405 |
Source: Public Records
Map
Nearby Homes
- 102 Dogwood Dr
- 202 Park Hill Dr
- 706 N Harlem Cir
- 203 Bonaventure Dr
- 616 S Harlem Cir
- 900 North St
- 806 New Franklin Rd
- 224 Rutland Cir
- 110 Russell St
- 131 Foch St
- 204 Colonial St
- 114 Briarcliff Rd
- 219 Banks St
- 210 Hearthstone Dr
- 109 Thomas St
- 87 Youngs Mill Rd
- 301 E Bacon St
- 0 Ridley Ave Unit 10550104
- 609 Ridley Ave
- 707 Ridley Ave
- 346 Laurel Ln
- 338 Laurel Ln
- 329 Park Hill Dr
- 334 Laurel Ln
- 331 Park Hill Dr
- 343 Laurel Ln
- 339 Laurel Ln
- 323 Park Hill Dr
- 323 Park Hill Dr Unit 27
- 325 Hickory Terrace
- 347 Laurel Ln
- 335 Laurel Ln
- 330 Laurel Ln
- 335 Park Hill Dr
- 351 Laurel Ln
- 319 Park Hill Dr
- 331 Laurel Ln
- 318 Park Hill Dr
- 356 Hickory Terrace
- 326 Laurel Ln
Your Personal Tour Guide
Ask me questions while you tour the home.