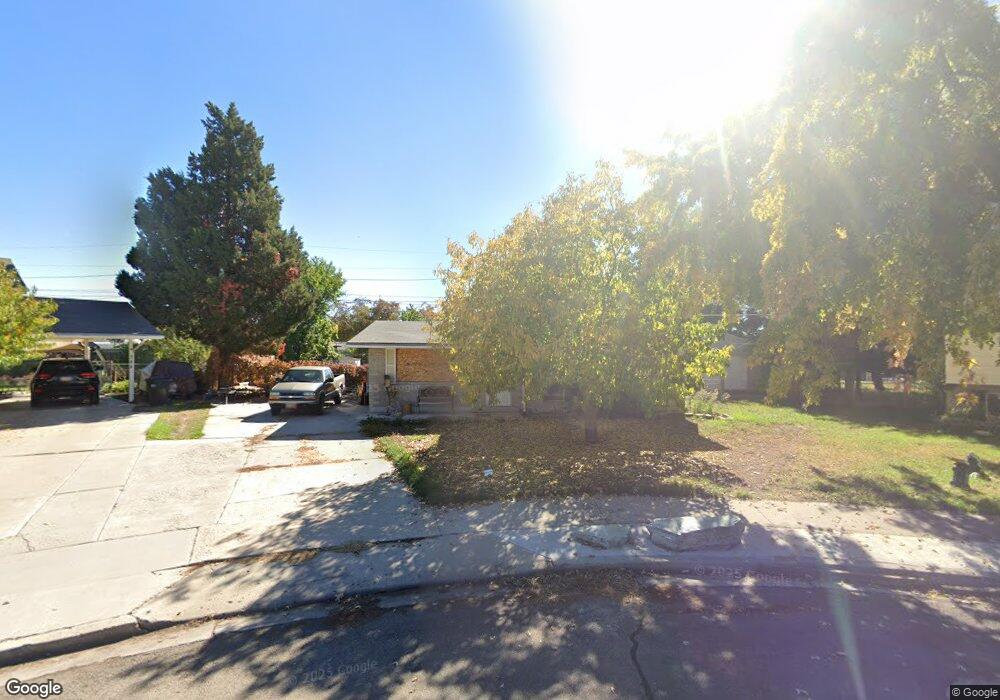
342 N 1170 W Provo, UT 84601
Rivergrove NeighborhoodEstimated Value: $419,000 - $446,000
3
Beds
1
Bath
1,432
Sq Ft
$302/Sq Ft
Est. Value
About This Home
This home is located at 342 N 1170 W, Provo, UT 84601 and is currently estimated at $432,404, approximately $301 per square foot. 342 N 1170 W is a home located in Utah County with nearby schools including Timpanogos Elementary School, Dixon Middle School, and Provo High School.
Ownership History
Date
Name
Owned For
Owner Type
Purchase Details
Closed on
Jun 23, 2010
Sold by
Damani Megan and Damani Kelly
Bought by
Robertson Craig D
Current Estimated Value
Home Financials for this Owner
Home Financials are based on the most recent Mortgage that was taken out on this home.
Original Mortgage
$128,272
Outstanding Balance
$85,035
Interest Rate
4.75%
Mortgage Type
FHA
Estimated Equity
$347,369
Purchase Details
Closed on
Jan 8, 2001
Sold by
Currie Charlene Fawns
Bought by
Gatenby Tony J
Home Financials for this Owner
Home Financials are based on the most recent Mortgage that was taken out on this home.
Original Mortgage
$121,588
Interest Rate
7.71%
Mortgage Type
FHA
Create a Home Valuation Report for This Property
The Home Valuation Report is an in-depth analysis detailing your home's value as well as a comparison with similar homes in the area
Home Values in the Area
Average Home Value in this Area
Purchase History
| Date | Buyer | Sale Price | Title Company |
|---|---|---|---|
| Robertson Craig D | -- | Keystone Title Insurance Ag | |
| Gatenby Tony J | -- | Titlewriters Inc |
Source: Public Records
Mortgage History
| Date | Status | Borrower | Loan Amount |
|---|---|---|---|
| Open | Robertson Craig D | $128,272 | |
| Previous Owner | Gatenby Tony J | $121,588 |
Source: Public Records
Tax History Compared to Growth
Tax History
| Year | Tax Paid | Tax Assessment Tax Assessment Total Assessment is a certain percentage of the fair market value that is determined by local assessors to be the total taxable value of land and additions on the property. | Land | Improvement |
|---|---|---|---|---|
| 2025 | $1,948 | $208,615 | $152,000 | $227,300 |
| 2024 | $1,948 | $191,730 | $0 | $0 |
| 2023 | $1,964 | $190,575 | $0 | $0 |
| 2022 | $1,829 | $178,970 | $0 | $0 |
| 2021 | $1,367 | $233,300 | $96,500 | $136,800 |
| 2020 | $1,177 | $212,100 | $87,700 | $124,400 |
| 2019 | $1,177 | $195,900 | $87,700 | $108,200 |
| 2018 | $1,057 | $178,300 | $84,200 | $94,100 |
| 2017 | $1,016 | $94,215 | $0 | $0 |
| 2016 | $955 | $82,555 | $0 | $0 |
| 2015 | $945 | $82,555 | $0 | $0 |
| 2014 | $885 | $80,630 | $0 | $0 |
Source: Public Records
Map
Nearby Homes