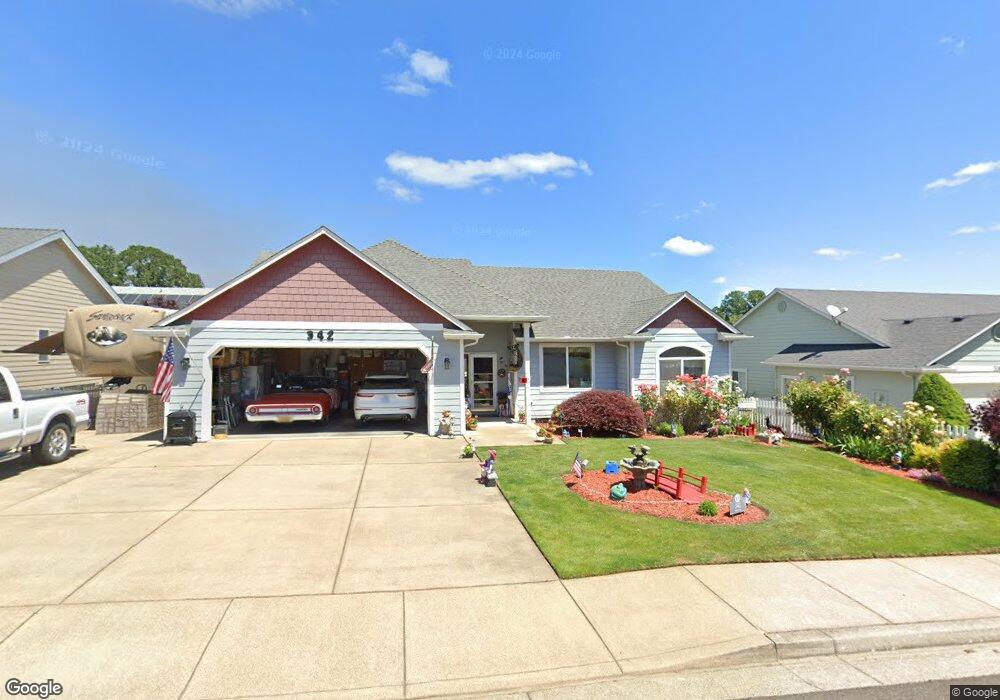
342 NW Ivy Ave Dallas, OR 97338
Estimated Value: $497,724 - $532,000
3
Beds
2
Baths
1,832
Sq Ft
$281/Sq Ft
Est. Value
About This Home
This home is located at 342 NW Ivy Ave, Dallas, OR 97338 and is currently estimated at $515,431, approximately $281 per square foot. 342 NW Ivy Ave is a home located in Polk County with nearby schools including Lyle Elementary School, Whitworth Elementary School, and LaCreole Middle School.
Ownership History
Date
Name
Owned For
Owner Type
Purchase Details
Closed on
May 10, 2016
Sold by
Jones Darrel W and Jones Judith A
Bought by
The Darrel W Jones & Judith A Jones Trus
Current Estimated Value
Purchase Details
Closed on
Nov 18, 2011
Sold by
Washburn Russell William
Bought by
Jones Darrel W and Jones Judith A
Purchase Details
Closed on
Feb 13, 2007
Sold by
Perrydale Homes Inc
Bought by
Washburn Russell William and Washburn Mary Ellen
Purchase Details
Closed on
Aug 24, 2006
Sold by
Boylan Construction Inc
Bought by
Perrydale Homes Inc
Purchase Details
Closed on
Jun 15, 2006
Sold by
Hilligoss Homes Inc
Bought by
Boylan Construction Inc
Home Financials for this Owner
Home Financials are based on the most recent Mortgage that was taken out on this home.
Original Mortgage
$60,750
Interest Rate
6.55%
Mortgage Type
Credit Line Revolving
Create a Home Valuation Report for This Property
The Home Valuation Report is an in-depth analysis detailing your home's value as well as a comparison with similar homes in the area
Home Values in the Area
Average Home Value in this Area
Purchase History
| Date | Buyer | Sale Price | Title Company |
|---|---|---|---|
| The Darrel W Jones & Judith A Jones Trus | -- | None Available | |
| Jones Darrel W | $235,000 | First American Title | |
| Washburn Russell William | $285,000 | First American Title | |
| Perrydale Homes Inc | $81,000 | First American Title | |
| Boylan Construction Inc | $81,000 | Ticor Title |
Source: Public Records
Mortgage History
| Date | Status | Borrower | Loan Amount |
|---|---|---|---|
| Previous Owner | Boylan Construction Inc | $60,750 |
Source: Public Records
Tax History Compared to Growth
Tax History
| Year | Tax Paid | Tax Assessment Tax Assessment Total Assessment is a certain percentage of the fair market value that is determined by local assessors to be the total taxable value of land and additions on the property. | Land | Improvement |
|---|---|---|---|---|
| 2025 | $3,394 | $274,080 | $75,530 | $198,550 |
| 2024 | $3,394 | $266,100 | $73,330 | $192,770 |
| 2023 | $3,263 | $258,350 | $71,190 | $187,160 |
| 2022 | $3,515 | $250,830 | $69,110 | $181,720 |
| 2021 | $3,418 | $243,530 | $67,100 | $176,430 |
| 2020 | $3,321 | $236,440 | $65,150 | $171,290 |
| 2019 | $3,225 | $229,560 | $63,250 | $166,310 |
| 2018 | $3,216 | $222,880 | $61,400 | $161,480 |
| 2017 | $3,090 | $216,390 | $59,620 | $156,770 |
| 2016 | $3,109 | $210,090 | $57,890 | $152,200 |
| 2015 | $3,066 | $203,980 | $56,200 | $147,780 |
| 2014 | $2,967 | $198,040 | $54,560 | $143,480 |
Source: Public Records
Map
Nearby Homes
- 607 NW Heath St
- 610 NW Hillcrest Dr
- 338 NW Foxglove St
- 540 NW Hillcrest Dr
- 466 NW Denton Ave
- 467 NW Denton Ave
- 595 NW Denton Ave
- 553 NW Douglas St
- 192 NW Denton Ave
- 0 Tbd Unit 700 702 198653503
- 694 Orchard Dr
- 140 Orchard Dr
- 175 NE Fern Ct
- 257 NW Douglas (-259) St
- 253/ 255 NW Douglas St
- 147 NW Douglas St
- 221 SW Rainbow Ave
- 845 Perrydale Rd
- 446 NE Fern Ave
- 373 SW Church St
- 338 NW Ivy Ave
- - NW Heath St Unit 11
- - NW Heath St Unit 12
- - NW Heath St Unit 8
- - NW Heath St Lots 8 11 12
- - NW Heath St
- 347 NW Reed Ln
- 335 NW Reed Ln
- 678 NW Heath St
- 360 NW Ivy Ave
- 330 NW Ivy Ave
- 361 NW Reed Ln
- 675 NW Hays Dr
- 329 NW Reed Ln
- 671 NW Heath St
- 000 Ivy Ave
- - NW Ivy Av (Lot 94)
- - NW Ivy Av (Lot 93)
- Lot 65 NW Reed Ln
- Lot 77 NW Reed Ln