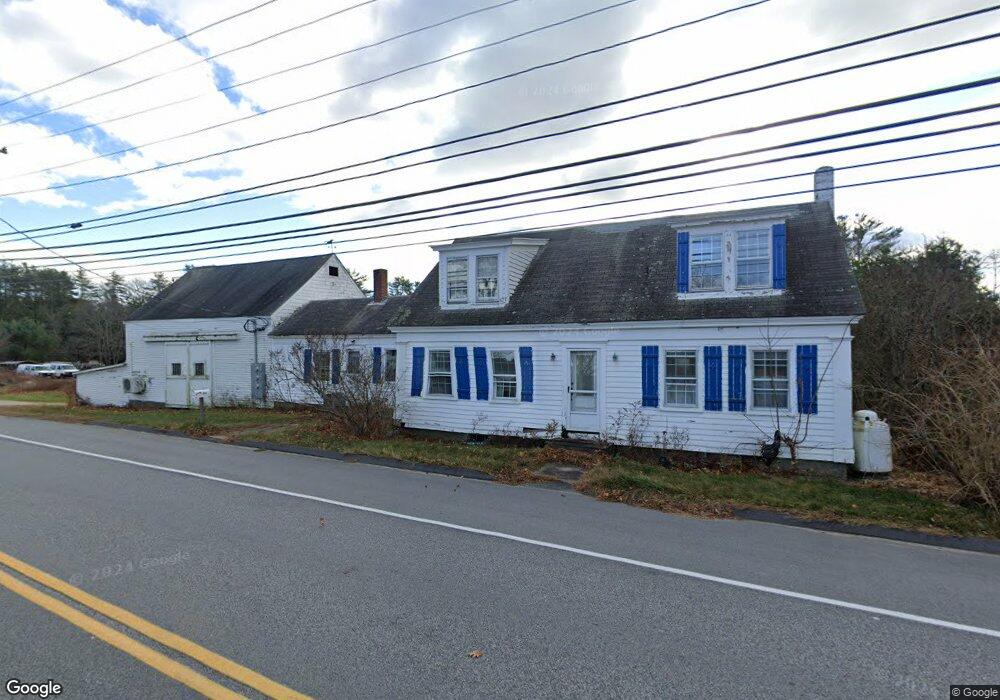
342 Pool St Biddeford, ME 04005
South Biddeford NeighborhoodEstimated Value: $474,000 - $623,000
4
Beds
2
Baths
2,030
Sq Ft
$262/Sq Ft
Est. Value
About This Home
This home is located at 342 Pool St, Biddeford, ME 04005 and is currently estimated at $531,628, approximately $261 per square foot. 342 Pool St is a home located in York County with nearby schools including John F Kennedy Memorial School, Biddeford Primary School, and Biddeford Intermediate School.
Ownership History
Date
Name
Owned For
Owner Type
Purchase Details
Closed on
Dec 3, 2008
Sold by
Morrell Robert E
Bought by
Morrell Robert E and Brazen Vincent J
Current Estimated Value
Home Financials for this Owner
Home Financials are based on the most recent Mortgage that was taken out on this home.
Original Mortgage
$216,060
Outstanding Balance
$139,669
Interest Rate
6.11%
Mortgage Type
FHA
Estimated Equity
$391,959
Purchase Details
Closed on
Feb 7, 2005
Sold by
Kenny Terry L and Kenny Brian A
Bought by
Morrell Robert
Home Financials for this Owner
Home Financials are based on the most recent Mortgage that was taken out on this home.
Original Mortgage
$216,000
Interest Rate
5.77%
Mortgage Type
Purchase Money Mortgage
Create a Home Valuation Report for This Property
The Home Valuation Report is an in-depth analysis detailing your home's value as well as a comparison with similar homes in the area
Home Values in the Area
Average Home Value in this Area
Purchase History
| Date | Buyer | Sale Price | Title Company |
|---|---|---|---|
| Morrell Robert E | -- | -- | |
| Morrell Robert | -- | -- |
Source: Public Records
Mortgage History
| Date | Status | Borrower | Loan Amount |
|---|---|---|---|
| Open | Morrell Robert E | $216,060 | |
| Previous Owner | Morrell Robert | $216,000 | |
| Previous Owner | Morrell Robert | $40,500 |
Source: Public Records
Tax History
| Year | Tax Paid | Tax Assessment Tax Assessment Total Assessment is a certain percentage of the fair market value that is determined by local assessors to be the total taxable value of land and additions on the property. | Land | Improvement |
|---|---|---|---|---|
| 2025 | $6,045 | $404,600 | $208,500 | $196,100 |
| 2024 | $5,709 | $401,500 | $208,500 | $193,000 |
| 2023 | $5,188 | $395,400 | $204,800 | $190,600 |
| 2022 | $4,385 | $267,200 | $133,500 | $133,700 |
| 2021 | $3,757 | $231,100 | $112,900 | $118,200 |
| 2020 | $4,206 | $209,800 | $102,800 | $107,000 |
| 2019 | $4,192 | $209,800 | $102,800 | $107,000 |
| 2018 | $4,133 | $209,800 | $102,800 | $107,000 |
| 2017 | $4,138 | $206,200 | $102,800 | $103,400 |
| 2016 | $4,095 | $206,200 | $102,800 | $103,400 |
| 2015 | $3,820 | $206,200 | $102,800 | $103,400 |
| 2014 | $3,726 | $206,200 | $102,800 | $103,400 |
| 2013 | -- | $240,000 | $114,400 | $125,600 |
Source: Public Records
Map
Nearby Homes
- 343 Pool St
- 353 Pool St
- 6 Decary Rd
- 378 Pool St
- 38 Pine Ridge Rd
- 12 Marial Ave
- 26 Meeting House Rd
- 295 Ferry Rd
- 79 Ferry Rd
- 74 Guinea Rd
- TBD 530 Ferry Rd
- 3 Walker Dr Unit 101
- 4 Walker Dr Unit 101
- 2 Breakwater Way Unit 2
- 3 Walker Dr Unit 101
- 5 Trix Ln
- 170 Cleaves St
- 11 Peabody Ln Unit 101
- 9 Windward Ridge
- 5 Twin Island Dr
Your Personal Tour Guide
Ask me questions while you tour the home.