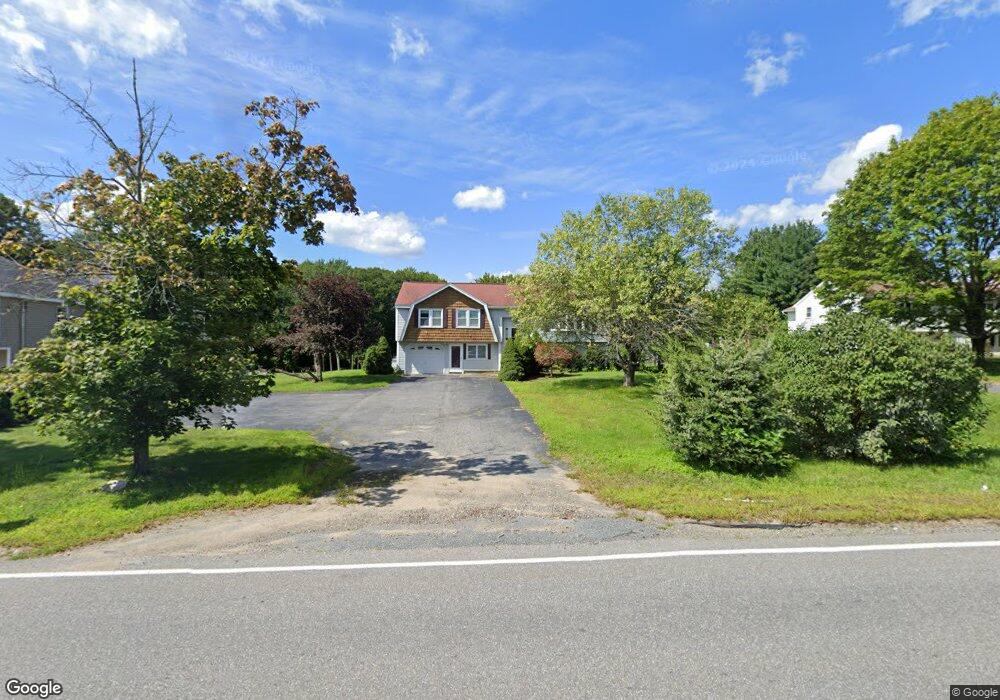
342 South St Northborough, MA 01532
Estimated Value: $681,000 - $856,000
3
Beds
4
Baths
1,900
Sq Ft
$383/Sq Ft
Est. Value
About This Home
This home is located at 342 South St, Northborough, MA 01532 and is currently estimated at $728,448, approximately $383 per square foot. 342 South St is a home located in Worcester County with nearby schools including Fannie E. Proctor Elementary School, Robert E. Melican Middle School, and Algonquin Regional High School.
Ownership History
Date
Name
Owned For
Owner Type
Purchase Details
Closed on
May 7, 2010
Sold by
Fnma
Bought by
Chang Chien-I and Wei Hua Jung
Current Estimated Value
Purchase Details
Closed on
Jan 5, 2010
Sold by
Brown Georgia R
Bought by
Federal National Mortgage Association
Purchase Details
Closed on
Aug 5, 1996
Sold by
Odonnell Michae J and Odonnell Norma
Bought by
Brown Thomas M and Brown Georgia
Purchase Details
Closed on
Oct 2, 1989
Sold by
Glickman M Ernest
Bought by
Odonnell Michael
Create a Home Valuation Report for This Property
The Home Valuation Report is an in-depth analysis detailing your home's value as well as a comparison with similar homes in the area
Home Values in the Area
Average Home Value in this Area
Purchase History
| Date | Buyer | Sale Price | Title Company |
|---|---|---|---|
| Chang Chien-I | $311,500 | -- | |
| Federal National Mortgage Association | $357,417 | -- | |
| Brown Thomas M | $180,000 | -- | |
| Odonnell Michael | $170,000 | -- |
Source: Public Records
Mortgage History
| Date | Status | Borrower | Loan Amount |
|---|---|---|---|
| Previous Owner | Odonnell Michael | $100,000 |
Source: Public Records
Tax History Compared to Growth
Tax History
| Year | Tax Paid | Tax Assessment Tax Assessment Total Assessment is a certain percentage of the fair market value that is determined by local assessors to be the total taxable value of land and additions on the property. | Land | Improvement |
|---|---|---|---|---|
| 2025 | $8,799 | $617,500 | $244,500 | $373,000 |
| 2024 | $7,894 | $552,800 | $197,900 | $354,900 |
| 2023 | $7,720 | $522,000 | $186,600 | $335,400 |
| 2022 | $7,345 | $445,400 | $177,700 | $267,700 |
| 2021 | $7,076 | $413,300 | $161,400 | $251,900 |
| 2020 | $7,117 | $412,600 | $161,400 | $251,200 |
| 2019 | $6,999 | $408,100 | $161,400 | $246,700 |
| 2018 | $6,554 | $376,900 | $155,300 | $221,600 |
| 2017 | $6,328 | $363,900 | $155,300 | $208,600 |
| 2016 | $5,953 | $346,700 | $151,900 | $194,800 |
| 2015 | $5,871 | $350,900 | $160,200 | $190,700 |
| 2014 | $5,629 | $339,300 | $160,200 | $179,100 |
Source: Public Records
Map
Nearby Homes
- 12 Saddle Hill Dr
- 349 Brigham St
- 1 Hamilton Rd
- 223 South St
- 59 Indian Meadow Dr
- 198 South St
- 185-187 South St
- 139 Davis St
- 11 Hillside Rd
- 19 Crestwood Dr Unit 19
- 71 Summer St
- 8 Stagecoach Cir Unit 8
- 22 Hitching Post Ln
- 59 School St Unit A-14
- 196 -198 Turnpike Rd
- 155 Milk St Unit 5
- 155 Milk St Unit 27
- 9 Shaker Way
- 132 W Main St
- 52 Treetop Park Unit 52