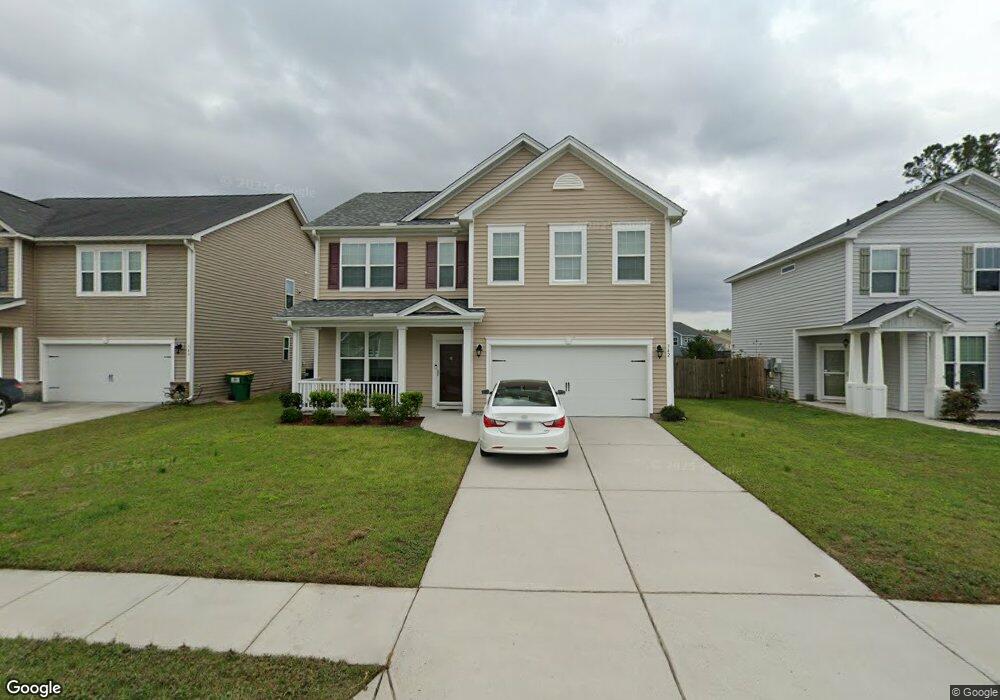
342 Southwilde Way Pooler, GA 31322
Estimated Value: $357,726 - $399,000
3
Beds
3
Baths
2,364
Sq Ft
$162/Sq Ft
Est. Value
About This Home
This home is located at 342 Southwilde Way, Pooler, GA 31322 and is currently estimated at $383,432, approximately $162 per square foot. 342 Southwilde Way is a home located in Chatham County with nearby schools including Groves High School and Savannah Adventist Christian School.
Ownership History
Date
Name
Owned For
Owner Type
Purchase Details
Closed on
Jan 10, 2020
Sold by
Chernyshov Alexander Y
Bought by
Kujawski Meagan and Bailey Marshall
Current Estimated Value
Home Financials for this Owner
Home Financials are based on the most recent Mortgage that was taken out on this home.
Original Mortgage
$232,750
Outstanding Balance
$206,157
Interest Rate
3.73%
Mortgage Type
New Conventional
Estimated Equity
$177,275
Purchase Details
Closed on
Feb 15, 2017
Sold by
Ebel Chad T
Bought by
Chernyshov Alexander Y
Home Financials for this Owner
Home Financials are based on the most recent Mortgage that was taken out on this home.
Original Mortgage
$211,765
Interest Rate
4.09%
Mortgage Type
VA
Purchase Details
Closed on
Feb 17, 2015
Sold by
Beazer Homes Corp
Bought by
Ebel Chad T
Home Financials for this Owner
Home Financials are based on the most recent Mortgage that was taken out on this home.
Original Mortgage
$183,906
Interest Rate
3.74%
Mortgage Type
New Conventional
Create a Home Valuation Report for This Property
The Home Valuation Report is an in-depth analysis detailing your home's value as well as a comparison with similar homes in the area
Home Values in the Area
Average Home Value in this Area
Purchase History
| Date | Buyer | Sale Price | Title Company |
|---|---|---|---|
| Kujawski Meagan | $245,000 | -- | |
| Chernyshov Alexander Y | $205,000 | -- | |
| Ebel Chad T | $193,585 | -- |
Source: Public Records
Mortgage History
| Date | Status | Borrower | Loan Amount |
|---|---|---|---|
| Open | Kujawski Meagan | $232,750 | |
| Previous Owner | Chernyshov Alexander Y | $211,765 | |
| Previous Owner | Ebel Chad T | $183,906 |
Source: Public Records
Tax History Compared to Growth
Tax History
| Year | Tax Paid | Tax Assessment Tax Assessment Total Assessment is a certain percentage of the fair market value that is determined by local assessors to be the total taxable value of land and additions on the property. | Land | Improvement |
|---|---|---|---|---|
| 2025 | $2,902 | $135,120 | $24,000 | $111,120 |
| 2024 | $2,902 | $134,080 | $24,000 | $110,080 |
| 2023 | $2,240 | $113,000 | $10,000 | $103,000 |
| 2022 | $2,813 | $102,880 | $10,000 | $92,880 |
| 2021 | $2,745 | $89,000 | $10,000 | $79,000 |
| 2020 | $2,959 | $86,560 | $10,000 | $76,560 |
| 2019 | $2,958 | $86,560 | $10,000 | $76,560 |
| 2018 | $2,459 | $82,000 | $9,840 | $72,160 |
| 2017 | $2,445 | $77,200 | $10,000 | $67,200 |
| 2016 | $2,445 | $76,200 | $10,000 | $66,200 |
| 2015 | $1,402 | $43,480 | $10,000 | $33,480 |
| 2014 | $317 | $10,000 | $0 | $0 |
Source: Public Records
Map
Nearby Homes
- 340 Southwilde Way
- 344 Southwilde Way
- 338 Southwilde Way
- 346 Southwilde Way
- 519 Viceroy Dr
- 519 Vicerory Dr
- 336 Southwilde Way
- 237 Tahoe Dr
- 348 Southwilde Way
- 234 Tahoe Dr
- 345 Southwilde Way
- 517 Viceroy Dr
- 334 Southwilde Way
- 347 Southwilde Way
- 350 Southwilde Way
- 520 Viceroy Dr
- 235 Tahoe Dr
- 349 Southwilde Way
- 232 Tahoe Dr
- 515 Viceroy Dr