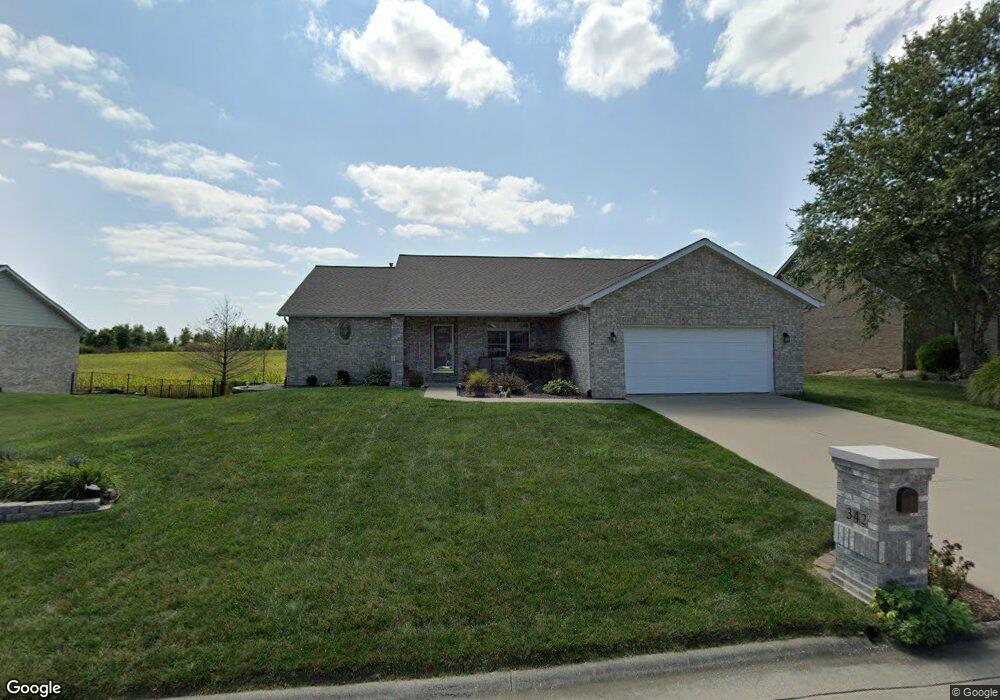
342 Summers Trace Belleville, IL 62220
Estimated Value: $302,000 - $341,000
Studio
--
Bath
1,965
Sq Ft
$162/Sq Ft
Est. Value
About This Home
This home is located at 342 Summers Trace, Belleville, IL 62220 and is currently estimated at $319,275, approximately $162 per square foot. 342 Summers Trace is a home located in St. Clair County with nearby schools including Roosevelt Elementary School, Central Jr High School, and Governor French Academy.
Ownership History
Date
Name
Owned For
Owner Type
Purchase Details
Closed on
Nov 1, 2003
Sold by
Wilson Keith
Bought by
Wilson Keith and Wilson Cindy A
Current Estimated Value
Home Financials for this Owner
Home Financials are based on the most recent Mortgage that was taken out on this home.
Original Mortgage
$103,000
Outstanding Balance
$48,790
Interest Rate
6.43%
Mortgage Type
Purchase Money Mortgage
Estimated Equity
$270,485
Purchase Details
Closed on
Oct 10, 2003
Sold by
Pcf Construction Inc
Bought by
Wilson Keith
Home Financials for this Owner
Home Financials are based on the most recent Mortgage that was taken out on this home.
Original Mortgage
$103,000
Outstanding Balance
$48,790
Interest Rate
6.43%
Mortgage Type
Purchase Money Mortgage
Estimated Equity
$270,485
Purchase Details
Closed on
Oct 18, 2002
Sold by
Cirrus Development Inc
Bought by
Pcf Construction Inc
Create a Home Valuation Report for This Property
The Home Valuation Report is an in-depth analysis detailing your home's value as well as a comparison with similar homes in the area
Home Values in the Area
Average Home Value in this Area
Purchase History
| Date | Buyer | Sale Price | Title Company |
|---|---|---|---|
| Wilson Keith | -- | Pti | |
| Wilson Keith | $184,000 | Pti | |
| Pcf Construction Inc | $33,000 | -- |
Source: Public Records
Mortgage History
| Date | Status | Borrower | Loan Amount |
|---|---|---|---|
| Open | Wilson Keith | $103,000 |
Source: Public Records
Tax History
| Year | Tax Paid | Tax Assessment Tax Assessment Total Assessment is a certain percentage of the fair market value that is determined by local assessors to be the total taxable value of land and additions on the property. | Land | Improvement |
|---|---|---|---|---|
| 2024 | $7,565 | $92,029 | $14,793 | $77,236 |
| 2023 | $7,134 | $82,000 | $14,500 | $67,500 |
| 2022 | $6,491 | $73,821 | $13,054 | $60,767 |
| 2021 | $6,206 | $68,245 | $12,068 | $56,177 |
| 2020 | $6,011 | $64,578 | $11,412 | $53,166 |
| 2019 | $5,940 | $63,339 | $11,431 | $51,908 |
| 2018 | $5,795 | $61,970 | $11,184 | $50,786 |
| 2017 | $5,751 | $61,534 | $11,105 | $50,429 |
| 2016 | $5,673 | $60,227 | $10,869 | $49,358 |
| 2014 | $4,807 | $57,984 | $11,284 | $46,700 |
| 2013 | $4,806 | $58,813 | $11,445 | $47,368 |
Source: Public Records
Map
Nearby Homes
- 245 Summers Trace
- 218 Winterberry Dr
- 516 Springwood Dr
- 66 Dianne Dr
- 34 Lake Forest Dr
- 1374 Rocky Creek Ct
- 1366 Radden Ct
- 1500 State Street Rd
- 420 State St
- 2049 Park Rd
- 807 Gass Ave
- 403 S Belt W
- 719 Centreville Ave
- 403 W Van Buren St
- 1412 4th Ave
- 1210 3rd Ave
- 315 S Belt W
- 817 Union Ave
- 611 Centreville Ave
- 91-110 Westhaven Meadows Dr
- 338 Summers Trace
- 346 Summers Trace
- 341 Summers Trace
- 337 Summers Trace
- 334 Summers Trace
- 345 Summers Trace
- 350 Summers Trace
- 333 Summers Trace
- 330 Summers Trace
- 340 Lake Forest Dr
- 336 Lake Forest Dr
- 354 Summers Trace
- 361 Summers Trace
- 329 Summers Trace
- 332 Lake Forest Dr
- 358 Summers Trace
- 326 Summers Trace
- 328 Lake Forest Dr
- 325 Summers Trace
- 362 Summers Trace
Your Personal Tour Guide
Ask me questions while you tour the home.