Estimated Value: $291,000 - $394,000
4
Beds
3
Baths
2,300
Sq Ft
$145/Sq Ft
Est. Value
About This Home
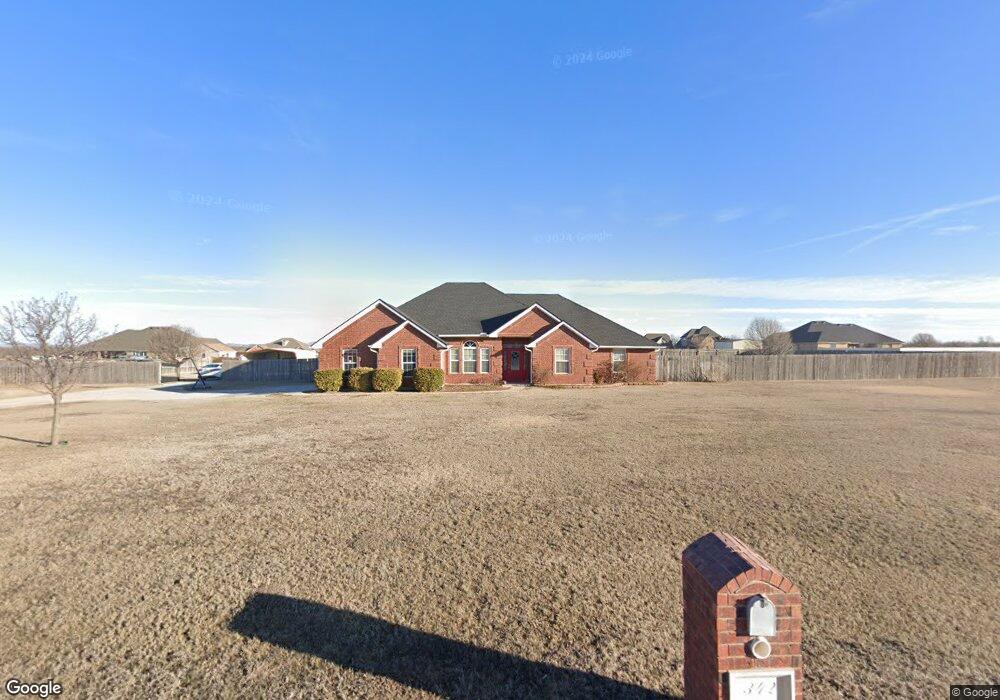
This home is located at 342 SW Deyo Landing Way, Cache, OK 73527 and is currently estimated at $333,188, approximately $144 per square foot. 342 SW Deyo Landing Way is a home located in Comanche County with nearby schools including Cache Primary Elementary School, Cache Intermediate Elementary School, and Cache Middle School.
Ownership History
Date
Name
Owned For
Owner Type
Purchase Details
Closed on
Sep 30, 2019
Sold by
Shirel Rodney L and Shirel Pauleta M
Bought by
Dorrell Matthew and Dorrell Brandy
Current Estimated Value
Home Financials for this Owner
Home Financials are based on the most recent Mortgage that was taken out on this home.
Original Mortgage
$188,000
Outstanding Balance
$164,842
Interest Rate
3.65%
Mortgage Type
New Conventional
Estimated Equity
$168,346
Purchase Details
Closed on
May 7, 2007
Sold by
Logue Larry and Logue Julie
Bought by
Shirel Rodney L and Shirel Pauleta M
Home Financials for this Owner
Home Financials are based on the most recent Mortgage that was taken out on this home.
Original Mortgage
$193,800
Interest Rate
6.13%
Mortgage Type
New Conventional
Purchase Details
Closed on
Oct 12, 2006
Sold by
Dabney Eddie and Dabney Susan E
Bought by
Logue Larry and Logue Julie
Home Financials for this Owner
Home Financials are based on the most recent Mortgage that was taken out on this home.
Original Mortgage
$170,019
Interest Rate
6.44%
Mortgage Type
Unknown
Create a Home Valuation Report for This Property
The Home Valuation Report is an in-depth analysis detailing your home's value as well as a comparison with similar homes in the area
Home Values in the Area
Average Home Value in this Area
Purchase History
| Date | Buyer | Sale Price | Title Company |
|---|---|---|---|
| Dorrell Matthew | $235,000 | Okf Title Services Llc | |
| Shirel Rodney L | $204,000 | -- | |
| Logue Larry | $21,500 | -- |
Source: Public Records
Mortgage History
| Date | Status | Borrower | Loan Amount |
|---|---|---|---|
| Open | Dorrell Matthew | $188,000 | |
| Previous Owner | Shirel Rodney L | $193,800 | |
| Previous Owner | Logue Larry | $170,019 |
Source: Public Records
Tax History Compared to Growth
Tax History
| Year | Tax Paid | Tax Assessment Tax Assessment Total Assessment is a certain percentage of the fair market value that is determined by local assessors to be the total taxable value of land and additions on the property. | Land | Improvement |
|---|---|---|---|---|
| 2025 | $2,877 | $28,043 | $3,088 | $24,955 |
| 2024 | $2,830 | $28,042 | $3,189 | $24,853 |
| 2023 | $2,830 | $26,434 | $2,813 | $23,621 |
| 2022 | $2,775 | $25,664 | $2,813 | $22,851 |
| 2021 | $2,176 | $24,349 | $2,813 | $21,536 |
| 2020 | $2,506 | $25,720 | $2,813 | $22,907 |
| 2019 | $2,663 | $27,113 | $2,813 | $24,300 |
| 2018 | $2,664 | $26,817 | $2,250 | $24,567 |
| 2017 | $2,605 | $27,084 | $2,250 | $24,834 |
| 2016 | $2,486 | $26,319 | $1,800 | $24,519 |
| 2015 | $2,447 | $26,319 | $1,800 | $24,519 |
| 2014 | $2,385 | $26,319 | $1,800 | $24,519 |
Source: Public Records
Map
Nearby Homes
- 7020 SW Deyo Mission Rd
- 6200 SW 112th St
- 6574 SW 112th St
- TBD SW 112th St Unit Lot 13, Deer Creek
- 6095 SW 112th St
- 513 SW Bradford Ln
- 1802 SW Paint Rd
- 621 SW Eden Place
- 2063 SW 45th St
- 12 SW 67th St
- 11 SW 67th St
- 3545 SW 67th St
- TBD SW 82nd & Lee Blvd
- 105 NW Valleybrook Dr
- 107 NW Valleybrook Dr
- 14 SW 67th St
- 10 SW 67th St
- 6813 SW Oakley
- 587 Spring Creek Rd
- 7 NW Havenshire Cir
- 330 SW Deyo Landing Way
- 363 SW Deyo Landing Way
- 447 SW Deyo Landing Loop
- 550 SW Deyo Landing Way
- 550 SW Deyo Landing Way
- 427 SW Deyo Landing Way
- 1528 SW Deyo Landing Loop
- 310 Deyo Landing
- 452 SW Deyo Landing Loop
- 298 SW Deyo Landing Loop
- 1304 SW Deyo Landing Loop
- 341 SW Deyo Landing Loop
- 1272 SW Deyo Landing Loop
- 525 SW Deyo Landing Loop
- 1424 SW Deyo Landing Loop
- 455 SW Deyo Landing Loop
- 1505 SW Deyo Landing Loop
- 1451 SW Deyo Landing Loop
- 1451 SW Deyo Landing Loop
- 300 SW Deyo Landing Loop