Estimated Value: $469,000 - $518,000
4
Beds
3
Baths
1,224
Sq Ft
$397/Sq Ft
Est. Value
About This Home
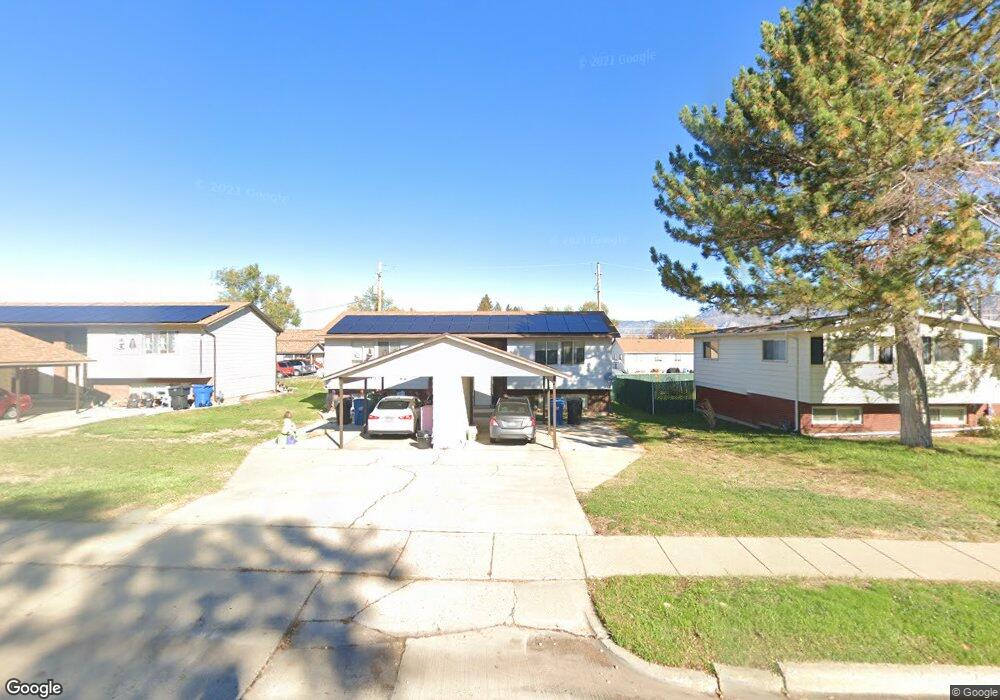
This home is located at 342 W 5200 S, Ogden, UT 84405 and is currently estimated at $485,914, approximately $396 per square foot. 342 W 5200 S is a home with nearby schools including Roosevelt School, T.H. Bell Junior High School, and Bonneville High School.
Ownership History
Date
Name
Owned For
Owner Type
Purchase Details
Closed on
Jun 4, 2019
Sold by
Behar Jacques R
Bought by
Behar Kidz Llc
Current Estimated Value
Purchase Details
Closed on
Feb 20, 2006
Sold by
Laron T Zaugg Investments Llc
Bought by
Behar Jacques R
Home Financials for this Owner
Home Financials are based on the most recent Mortgage that was taken out on this home.
Original Mortgage
$125,662
Outstanding Balance
$70,533
Interest Rate
6.15%
Mortgage Type
Seller Take Back
Estimated Equity
$415,381
Purchase Details
Closed on
Sep 14, 1999
Sold by
Oxborrow Stanley Bryant and Oxborrow Barbara Louise
Bought by
Laron T Zaugg Investments Llc
Home Financials for this Owner
Home Financials are based on the most recent Mortgage that was taken out on this home.
Original Mortgage
$96,000
Interest Rate
7.89%
Mortgage Type
Seller Take Back
Purchase Details
Closed on
Aug 4, 1997
Sold by
Weber County
Bought by
Bryant Stanley and Oxborrow Barbara Louise
Create a Home Valuation Report for This Property
The Home Valuation Report is an in-depth analysis detailing your home's value as well as a comparison with similar homes in the area
Home Values in the Area
Average Home Value in this Area
Purchase History
| Date | Buyer | Sale Price | Title Company |
|---|---|---|---|
| Behar Kidz Llc | -- | None Available | |
| Behar Jacques R | -- | Backman Title Services Ltd | |
| Laron T Zaugg Investments Llc | -- | -- | |
| Bryant Stanley | -- | -- |
Source: Public Records
Mortgage History
| Date | Status | Borrower | Loan Amount |
|---|---|---|---|
| Open | Behar Jacques R | $125,662 | |
| Previous Owner | Laron T Zaugg Investments Llc | $96,000 |
Source: Public Records
Tax History Compared to Growth
Tax History
| Year | Tax Paid | Tax Assessment Tax Assessment Total Assessment is a certain percentage of the fair market value that is determined by local assessors to be the total taxable value of land and additions on the property. | Land | Improvement |
|---|---|---|---|---|
| 2025 | $3,043 | $472,352 | $100,000 | $372,352 |
| 2024 | $3,043 | $473,000 | $100,000 | $373,000 |
| 2023 | $2,821 | $435,000 | $74,000 | $361,000 |
| 2022 | $2,824 | $450,000 | $50,000 | $400,000 |
| 2021 | $2,200 | $311,000 | $50,000 | $261,000 |
| 2020 | $2,183 | $283,000 | $43,196 | $239,804 |
| 2019 | $2,060 | $246,000 | $43,196 | $202,804 |
| 2018 | $1,677 | $192,000 | $43,196 | $148,804 |
| 2017 | $1,195 | $153,228 | $32,520 | $120,708 |
| 2016 | $1,086 | $76,429 | $17,600 | $58,829 |
| 2015 | $1,113 | $76,429 | $17,600 | $58,829 |
| 2014 | $1,180 | $79,613 | $17,600 | $62,013 |
Source: Public Records
Map
Nearby Homes