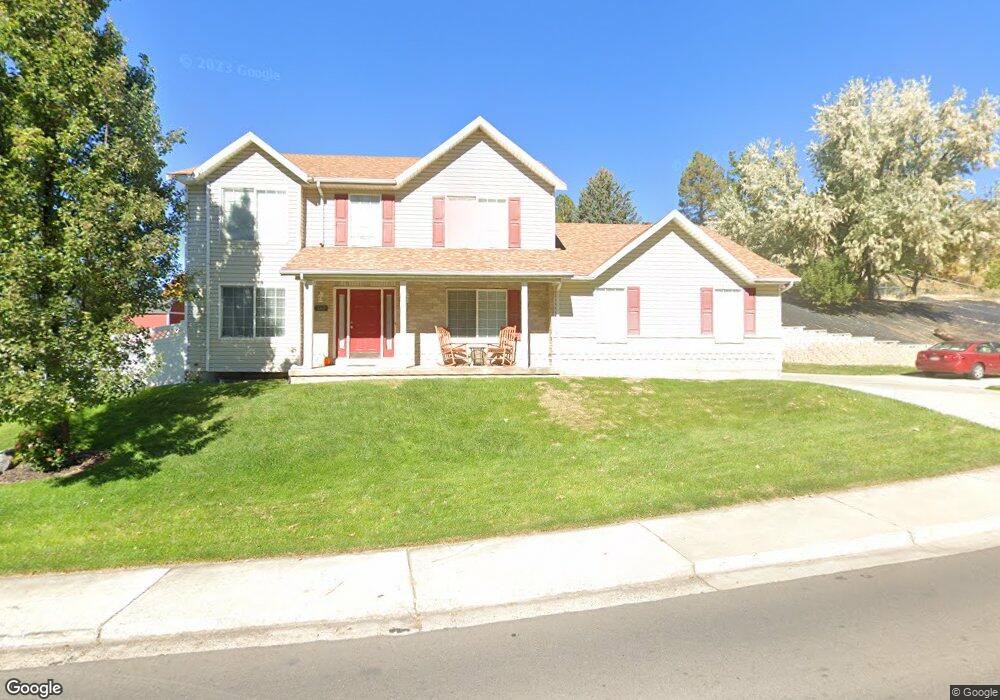
342 W Hidden Hollow Dr Orem, UT 84058
Lakeview NeighborhoodEstimated Value: $631,903 - $746,000
4
Beds
3
Baths
3,639
Sq Ft
$188/Sq Ft
Est. Value
About This Home
This home is located at 342 W Hidden Hollow Dr, Orem, UT 84058 and is currently estimated at $683,726, approximately $187 per square foot. 342 W Hidden Hollow Dr is a home located in Utah County with nearby schools including Cherry Hill Elementary School, Lakeridge Jr High School, and Mountain View High School.
Ownership History
Date
Name
Owned For
Owner Type
Purchase Details
Closed on
Feb 24, 2004
Sold by
Nielson Bruce L and Nielson Julene F
Bought by
Nielson Bruce L and Nielson Julene F
Current Estimated Value
Home Financials for this Owner
Home Financials are based on the most recent Mortgage that was taken out on this home.
Original Mortgage
$129,500
Interest Rate
5.62%
Mortgage Type
New Conventional
Purchase Details
Closed on
Aug 5, 2003
Sold by
Nielson Bruce L and Nielson Julene F
Bought by
Nielson Bruce L and Nielson Julene F
Purchase Details
Closed on
Feb 21, 1998
Sold by
Griffin Robert L and Griffin Kristin H
Bought by
Nielson Bruce L and Nielson Julene F
Home Financials for this Owner
Home Financials are based on the most recent Mortgage that was taken out on this home.
Original Mortgage
$166,100
Interest Rate
6.97%
Purchase Details
Closed on
Aug 25, 1997
Sold by
Griffin Robert L and Griffin Kristin
Bought by
Griffin Robert L and Griffin Kristin H
Home Financials for this Owner
Home Financials are based on the most recent Mortgage that was taken out on this home.
Original Mortgage
$160,000
Interest Rate
7.43%
Create a Home Valuation Report for This Property
The Home Valuation Report is an in-depth analysis detailing your home's value as well as a comparison with similar homes in the area
Home Values in the Area
Average Home Value in this Area
Purchase History
We collect this data history from publicly available records. To have your information removed, we recommend requesting removal directly through your county’s website.
| Date | Buyer | Sale Price | Title Company |
|---|---|---|---|
| Nielson Bruce L | -- | Equity Title | |
| Nielson Bruce L | -- | Equity Title | |
| Nielson Bruce L | -- | -- | |
| Nielson Bruce L | -- | First American Title | |
| Nielson Bruce L | -- | First American Title | |
| Griffin Robert L | -- | -- |
Source: Public Records
Mortgage History
We collect this data history from publicly available records. To have your information removed, we recommend requesting removal directly through your county’s website.
| Date | Status | Borrower | Loan Amount |
|---|---|---|---|
| Closed | Nielson Bruce L | $129,500 | |
| Closed | Nielson Bruce L | $166,100 | |
| Previous Owner | Griffin Robert L | $160,000 |
Source: Public Records
Tax History
| Year | Tax Paid | Tax Assessment Tax Assessment Total Assessment is a certain percentage of the fair market value that is determined by local assessors to be the total taxable value of land and additions on the property. | Land | Improvement |
|---|---|---|---|---|
| 2025 | $2,499 | $313,995 | -- | -- |
| 2024 | $2,499 | $305,525 | $0 | $0 |
| 2023 | $2,349 | $308,715 | $0 | $0 |
| 2022 | $2,659 | $338,580 | $0 | $0 |
| 2021 | $2,591 | $499,700 | $200,400 | $299,300 |
| 2020 | $2,423 | $459,300 | $174,300 | $285,000 |
| 2019 | $2,310 | $455,300 | $174,300 | $281,000 |
| 2018 | $2,235 | $420,900 | $174,300 | $246,600 |
| 2017 | $2,191 | $220,990 | $0 | $0 |
| 2016 | $2,502 | $232,760 | $0 | $0 |
| 2015 | $2,460 | $216,425 | $0 | $0 |
| 2014 | -- | $183,755 | $0 | $0 |
Source: Public Records
Map
Nearby Homes
- 372 W Hidden Hollow Dr
- 1677 S 350 W
- 1665 S 350 W
- 347 W Hidden Hollow Dr
- 1653 S 350 W
- 333 W Hidden Hollow Dr
- 1681 S 350 W
- 326 W 1700 S
- 314 W 1700 S Unit 30
- 345 W 1600 S
- 328 W Hidden Hollow Dr
- 1641 S 350 W
- 1676 S 350 W
- 302 W 1700 S
- 1686 S 350 W
- 325 W Hidden Hollow Dr
- 1662 S 350 W
- 375 W 1640 S
- 1688 S 350 W
- 292 W 1700 S
Your Personal Tour Guide
Ask me questions while you tour the home.