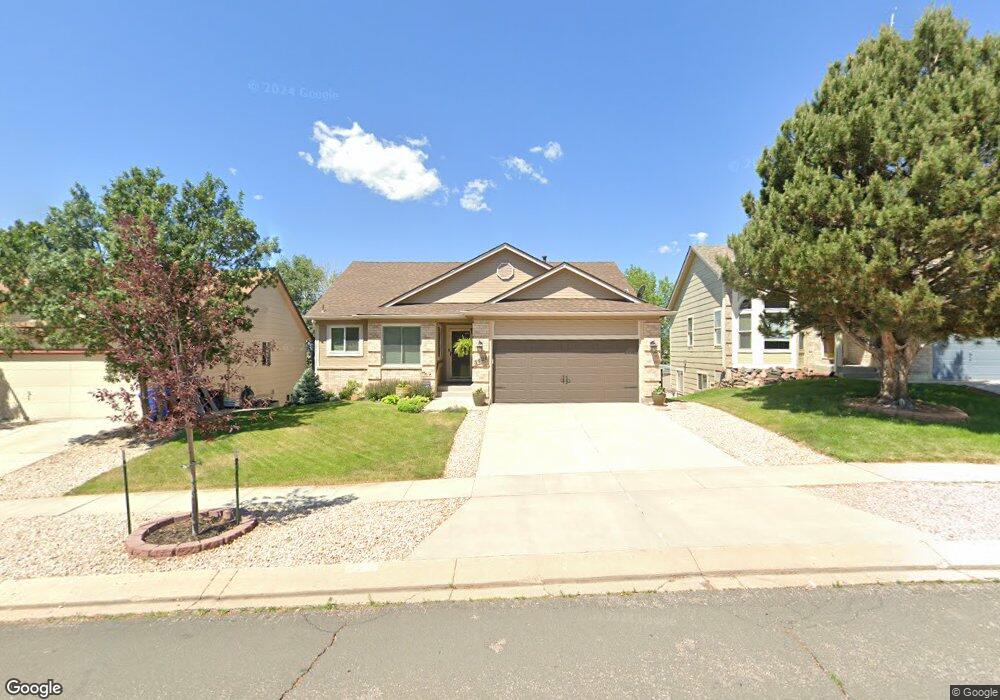
3420 Flying Horse Rd Colorado Springs, CO 80922
Springs Ranch NeighborhoodEstimated Value: $430,918 - $497,000
5
Beds
3
Baths
1,293
Sq Ft
$364/Sq Ft
Est. Value
About This Home
This home is located at 3420 Flying Horse Rd, Colorado Springs, CO 80922 and is currently estimated at $470,230, approximately $363 per square foot. 3420 Flying Horse Rd is a home located in El Paso County with nearby schools including Remington Elementary School, Horizon Middle School, and Sand Creek High School.
Ownership History
Date
Name
Owned For
Owner Type
Purchase Details
Closed on
Oct 28, 2016
Sold by
Street Gerald H and Street Judith K
Bought by
Lamb Jordan and Lamb Elisha
Current Estimated Value
Home Financials for this Owner
Home Financials are based on the most recent Mortgage that was taken out on this home.
Original Mortgage
$263,145
Outstanding Balance
$210,119
Interest Rate
3.25%
Mortgage Type
FHA
Estimated Equity
$260,111
Purchase Details
Closed on
Mar 14, 1997
Sold by
Lite Properties Of America Inc
Bought by
Street Gerald H and Street Judith K
Home Financials for this Owner
Home Financials are based on the most recent Mortgage that was taken out on this home.
Original Mortgage
$130,000
Interest Rate
7.89%
Purchase Details
Closed on
Nov 22, 1996
Sold by
Springs Ranch Ltd Liability Company
Bought by
Elite Properties Of America Inc
Purchase Details
Closed on
Nov 21, 1990
Bought by
Lamb Jordan
Create a Home Valuation Report for This Property
The Home Valuation Report is an in-depth analysis detailing your home's value as well as a comparison with similar homes in the area
Home Values in the Area
Average Home Value in this Area
Purchase History
| Date | Buyer | Sale Price | Title Company |
|---|---|---|---|
| Lamb Jordan | $268,000 | First American Title | |
| Street Gerald H | $172,178 | Land Title | |
| Elite Properties Of America Inc | $21,648 | -- | |
| Lamb Jordan | -- | -- |
Source: Public Records
Mortgage History
| Date | Status | Borrower | Loan Amount |
|---|---|---|---|
| Open | Lamb Jordan | $263,145 | |
| Previous Owner | Street Gerald H | $130,000 |
Source: Public Records
Tax History Compared to Growth
Tax History
| Year | Tax Paid | Tax Assessment Tax Assessment Total Assessment is a certain percentage of the fair market value that is determined by local assessors to be the total taxable value of land and additions on the property. | Land | Improvement |
|---|---|---|---|---|
| 2025 | $1,627 | $33,620 | -- | -- |
| 2024 | $1,528 | $31,240 | $4,620 | $26,620 |
| 2023 | $1,528 | $31,240 | $4,620 | $26,620 |
| 2022 | $1,371 | $23,520 | $4,170 | $19,350 |
| 2021 | $1,429 | $24,200 | $4,290 | $19,910 |
| 2020 | $1,303 | $21,790 | $3,580 | $18,210 |
| 2019 | $1,289 | $21,790 | $3,580 | $18,210 |
| 2018 | $1,061 | $17,590 | $3,020 | $14,570 |
| 2017 | $1,067 | $17,590 | $3,020 | $14,570 |
| 2016 | $605 | $17,800 | $2,950 | $14,850 |
| 2015 | $606 | $17,800 | $2,950 | $14,850 |
| 2014 | $534 | $16,470 | $2,790 | $13,680 |
Source: Public Records
Map
Nearby Homes
- 3525 Flying Horse Rd
- 3615 Bareback Dr
- 6510 Packsaddle Ct
- 635 Piros Dr
- 6622 Mcewan St
- 3032 Pony Tracks Dr
- The Palette Plan at Greenways at Sand Creek - Portrait Collection
- Savannah Plan at Greenways at Sand Creek - Classic Collection
- Preamble 271 Plan at Greenways at Sand Creek - Preamble Collection
- Preamble 273 Plan at Greenways at Sand Creek - Preamble Collection
- Providence II Plan at Greenways at Sand Creek - Classic Collection
- Daybreak Plan at Greenways at Sand Creek - Classic Collection
- Sundance Plan at Greenways at Sand Creek - Classic Collection
- Preamble 277 Plan at Greenways at Sand Creek - Preamble Collection
- The Canvas + ADU Plan at Greenways at Sand Creek - Portrait Collection
- The Canvas Plan at Greenways at Sand Creek - Portrait Collection
- The Paintbrush + ADU Plan at Greenways at Sand Creek - Portrait Collection
- Preamble 276 Plan at Greenways at Sand Creek - Preamble Collection
- Celebration Plan at Greenways at Sand Creek - Classic Collection
- Preamble 272 Plan at Greenways at Sand Creek - Preamble Collection
- 3430 Flying Horse Rd
- 3410 Flying Horse Rd
- 6920 Blazing Trail Dr
- 3390 Flying Horse Rd
- 3440 Flying Horse Rd
- 6910 Blazing Trail Dr
- 6940 Blazing Trail Dr
- 3450 Flying Horse Rd
- 3425 Flying Horse Rd
- 3380 Flying Horse Rd
- 6890 Blazing Trail Dr
- 3395 Flying Horse Rd
- 6950 Blazing Trail Dr
- 3445 Flying Horse Rd
- 3385 Flying Horse Rd
- 3460 Flying Horse Rd
- 3370 Flying Horse Rd
- 3455 Flying Horse Rd
- 6960 Blazing Trail Dr
- 6465 Bootstrap Ct