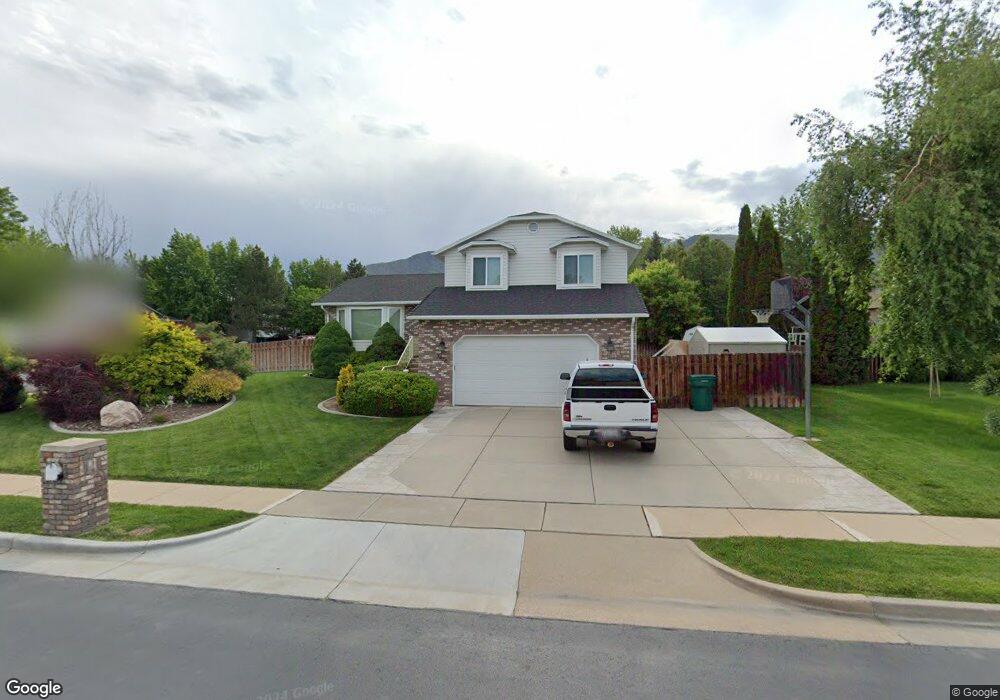
3420 N 2175 E Layton, UT 84040
Estimated Value: $505,000 - $559,000
5
Beds
2
Baths
1,932
Sq Ft
$270/Sq Ft
Est. Value
About This Home
This home is located at 3420 N 2175 E, Layton, UT 84040 and is currently estimated at $521,529, approximately $269 per square foot. 3420 N 2175 E is a home located in Davis County with nearby schools including Mountain View Elementary School, North Layton Junior High School, and Northridge High School.
Ownership History
Date
Name
Owned For
Owner Type
Purchase Details
Closed on
Jul 17, 2008
Sold by
Lichtie Ricky D
Bought by
Lichtie Rick
Current Estimated Value
Purchase Details
Closed on
Apr 30, 1997
Sold by
Miller Robert C
Bought by
Lichtie Ricky D
Home Financials for this Owner
Home Financials are based on the most recent Mortgage that was taken out on this home.
Original Mortgage
$142,320
Outstanding Balance
$18,176
Interest Rate
7.75%
Estimated Equity
$503,353
Purchase Details
Closed on
Feb 3, 1997
Sold by
Symphony Development Corp
Bought by
Miller Robert C
Home Financials for this Owner
Home Financials are based on the most recent Mortgage that was taken out on this home.
Original Mortgage
$118,000
Interest Rate
7.13%
Purchase Details
Closed on
Jan 22, 1997
Sold by
Fraley Paul B and Fraley Patsy L
Bought by
Symphony Development Corp
Home Financials for this Owner
Home Financials are based on the most recent Mortgage that was taken out on this home.
Original Mortgage
$118,000
Interest Rate
7.13%
Create a Home Valuation Report for This Property
The Home Valuation Report is an in-depth analysis detailing your home's value as well as a comparison with similar homes in the area
Home Values in the Area
Average Home Value in this Area
Purchase History
| Date | Buyer | Sale Price | Title Company |
|---|---|---|---|
| Lichtie Rick | -- | None Available | |
| Lichtie Ricky D | -- | Bonneville Title Company Inc | |
| Miller Robert C | -- | Associated Title Company | |
| Symphony Development Corp | -- | Bonneville Title Company Inc |
Source: Public Records
Mortgage History
| Date | Status | Borrower | Loan Amount |
|---|---|---|---|
| Open | Lichtie Ricky D | $142,320 | |
| Previous Owner | Miller Robert C | $118,000 | |
| Previous Owner | Symphony Development Corp | $50,000 |
Source: Public Records
Tax History
| Year | Tax Paid | Tax Assessment Tax Assessment Total Assessment is a certain percentage of the fair market value that is determined by local assessors to be the total taxable value of land and additions on the property. | Land | Improvement |
|---|---|---|---|---|
| 2025 | $2,750 | $262,350 | $117,602 | $144,748 |
| 2024 | $2,611 | $253,000 | $140,358 | $112,642 |
| 2023 | $2,554 | $441,000 | $138,235 | $302,765 |
| 2022 | $2,670 | $252,450 | $73,289 | $179,161 |
| 2021 | $2,465 | $347,000 | $119,628 | $227,372 |
| 2020 | $2,249 | $303,000 | $94,889 | $208,111 |
| 2019 | $2,204 | $293,000 | $97,763 | $195,237 |
| 2018 | $1,996 | $266,000 | $96,374 | $169,626 |
| 2016 | $1,769 | $123,805 | $47,118 | $76,687 |
| 2015 | $1,743 | $116,655 | $47,118 | $69,537 |
| 2014 | $1,724 | $118,923 | $40,972 | $77,951 |
| 2013 | -- | $104,456 | $31,020 | $73,436 |
Source: Public Records
Map
Nearby Homes
- 3232 N Redtail Way
- 2353 Canyon View Dr
- 1827 E Whitetail Dr
- 1821 E Whitetail Way
- 1935 Deere Valley Dr
- 1785 E 2825 N
- 1731 E 2825 N
- 3176 N 1450 E
- 2826 N 1600 E
- 2597 N 2300 E
- 2357 E 8100 S
- 3297 N Layton Ridge Dr
- 1321 E 3125 N
- 7886 S 2100 E
- 1266 E 3125 N
- 1241 E 3075 N
- 1447 E 2700 N
- 8036 S 2575 E
- 2569 N 2900 E
- 2586 Deer Run Dr
Your Personal Tour Guide
Ask me questions while you tour the home.