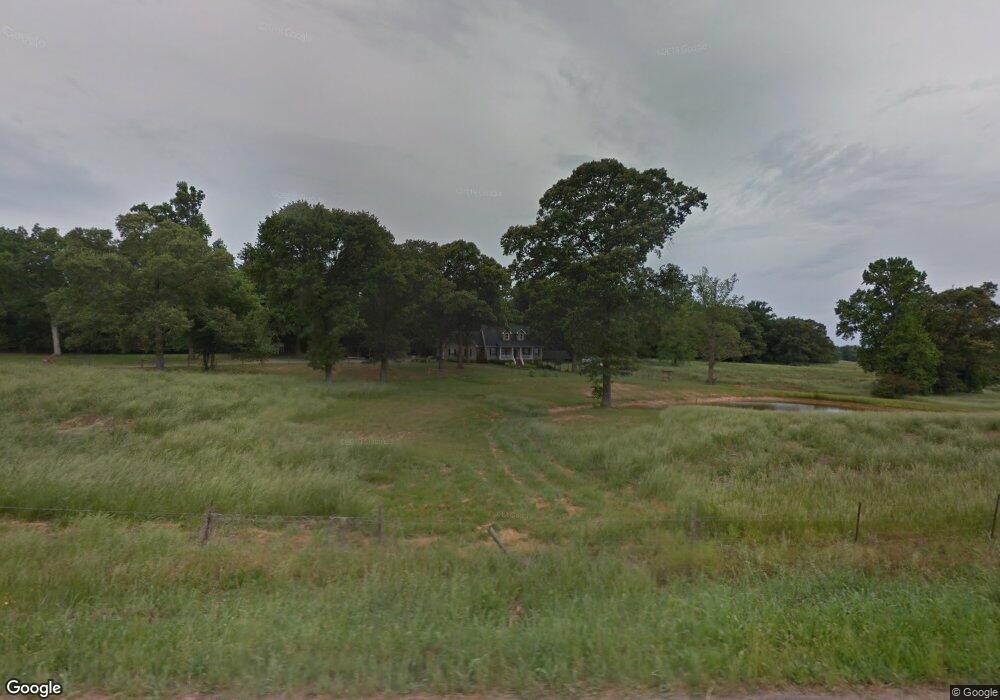
3420 Neese Commerce Rd Commerce, GA 30530
Estimated Value: $484,000 - $606,000
3
Beds
4
Baths
2,450
Sq Ft
$223/Sq Ft
Est. Value
About This Home
This home is located at 3420 Neese Commerce Rd, Commerce, GA 30530 and is currently estimated at $546,000, approximately $222 per square foot. 3420 Neese Commerce Rd is a home located in Madison County with nearby schools including Madison County High School and Union Christian Academy.
Ownership History
Date
Name
Owned For
Owner Type
Purchase Details
Closed on
Oct 11, 2017
Sold by
Caudell George E
Bought by
Ryman Matthew C and Ryman Valerie E
Current Estimated Value
Purchase Details
Closed on
Jul 19, 2005
Sold by
Cowart Bradley W
Bought by
Caudell George E and Caudell Kay W
Home Financials for this Owner
Home Financials are based on the most recent Mortgage that was taken out on this home.
Original Mortgage
$45,000
Interest Rate
5.51%
Mortgage Type
New Conventional
Purchase Details
Closed on
Sep 11, 2003
Sold by
Cowart Bradley W and Cowart Carrie B
Bought by
Cowart Bradley W and Cowart Carrie B
Purchase Details
Closed on
Feb 1, 2003
Sold by
Baxter William Ted
Bought by
Cowart Bradley W and Cowart Carrie B
Create a Home Valuation Report for This Property
The Home Valuation Report is an in-depth analysis detailing your home's value as well as a comparison with similar homes in the area
Home Values in the Area
Average Home Value in this Area
Purchase History
| Date | Buyer | Sale Price | Title Company |
|---|---|---|---|
| Ryman Matthew C | $286,000 | -- | |
| Caudell George E | $240,000 | -- | |
| Cowart Bradley W | -- | -- | |
| Cowart Bradley W | -- | -- |
Source: Public Records
Mortgage History
| Date | Status | Borrower | Loan Amount |
|---|---|---|---|
| Previous Owner | Caudell George E | $45,000 |
Source: Public Records
Tax History Compared to Growth
Tax History
| Year | Tax Paid | Tax Assessment Tax Assessment Total Assessment is a certain percentage of the fair market value that is determined by local assessors to be the total taxable value of land and additions on the property. | Land | Improvement |
|---|---|---|---|---|
| 2024 | $5,191 | $201,430 | $33,600 | $167,830 |
| 2023 | $5,657 | $185,302 | $28,000 | $157,302 |
| 2022 | $3,949 | $145,162 | $19,250 | $125,912 |
| 2021 | $3,515 | $117,144 | $19,250 | $97,894 |
| 2020 | $3,453 | $114,344 | $16,450 | $97,894 |
| 2019 | $3,422 | $110,045 | $14,100 | $95,945 |
| 2018 | $3,342 | $107,165 | $13,975 | $93,190 |
| 2017 | $2,757 | $95,764 | $13,000 | $82,764 |
| 2016 | $2,148 | $84,817 | $13,000 | $71,817 |
| 2015 | $2,145 | $84,817 | $13,000 | $71,817 |
| 2014 | $2,421 | $85,790 | $13,500 | $72,290 |
| 2013 | -- | $85,790 | $13,500 | $72,290 |
Source: Public Records
Map
Nearby Homes
- 3655 Neese Commerce Rd
- 8541 Georgia 334
- 1191 Aderhold Rogers Rd
- 495 Hanley Rd
- 0 Nowhere Rd Unit 10532129
- 397 W L Williams Rd
- 395 W L Williams Rd
- 16 W L Williams Rd
- 14 W L Williams Rd
- 399 W L Williams Rd
- 15 W L Williams Rd
- 9 W L Williams Rd
- 2345 Seagraves Mill Rd
- 393 W Unit GA 30530
- 742 Harmony Gates Dr
- 690 Harmony Gates Dr
- 1771 Leon Ellis Rd
- 1390 Groaning Rock Rd
- 110 Williams Wilson Rd
- 25 Williams Wilson Rd
- 3205 Neese Commerce Rd
- 1145 Sam Swindell Rd
- 3331 Neese Commerce Rd
- 3194 Neese Commerce Rd
- 1145 Sam Swindle Rd
- 3515 Adams Clarke Rd
- 3196 Neese Commerce Rd
- 3711 Neese Commerce Rd
- 2981 Neese Commerce Rd
- 3795 Neese Commerce Rd
- 3823 Neese Commerce Rd
- 3550 Adams Clarke Rd
- 1688 Lucky Jones Rd
- 3171 Adams Clarke Rd
- 1654 Lucky Jones Rd
- 2826 Commerce Neese Rd
- 635 Sam Swindle Rd
- 3214 Adams Clarke Rd
- 0 Sam Swindle Rd
- 1576 Lucky Jones Rd