34202 Sanders Ranch Rd Magnolia, TX 77355
Estimated Value: $726,029 - $819,000
--
Bed
1
Bath
3,227
Sq Ft
$239/Sq Ft
Est. Value
About This Home
This home is located at 34202 Sanders Ranch Rd, Magnolia, TX 77355 and is currently estimated at $771,507, approximately $239 per square foot. 34202 Sanders Ranch Rd is a home located in Montgomery County with nearby schools including Willie E. Williams Elementary School, Magnolia Sixth Grade Campus, and Magnolia Junior High School.
Ownership History
Date
Name
Owned For
Owner Type
Purchase Details
Closed on
Mar 17, 2006
Sold by
Artmann D Paul and Artmann Sherri
Bought by
Burk T J and Burk Charlotte
Current Estimated Value
Purchase Details
Closed on
Oct 21, 2005
Sold by
Gonzalez Paul and Gonzalez Nancy
Bought by
Artmann D Paul and Artmann Sherri
Home Financials for this Owner
Home Financials are based on the most recent Mortgage that was taken out on this home.
Original Mortgage
$32,000
Interest Rate
5.69%
Mortgage Type
Purchase Money Mortgage
Purchase Details
Closed on
Mar 7, 2001
Sold by
Clear Springs Development Company Ltd
Bought by
Burk Burk T and Burk Charlotte
Home Financials for this Owner
Home Financials are based on the most recent Mortgage that was taken out on this home.
Original Mortgage
$25,200
Interest Rate
7.19%
Create a Home Valuation Report for This Property
The Home Valuation Report is an in-depth analysis detailing your home's value as well as a comparison with similar homes in the area
Home Values in the Area
Average Home Value in this Area
Purchase History
| Date | Buyer | Sale Price | Title Company |
|---|---|---|---|
| Burk T J | -- | Alamo Title Company | |
| Artmann D Paul | -- | Texas American Title Company | |
| Burk Burk T | -- | -- | |
| Gonzalez Paul A | -- | First Surety Title |
Source: Public Records
Mortgage History
| Date | Status | Borrower | Loan Amount |
|---|---|---|---|
| Previous Owner | Artmann D Paul | $32,000 | |
| Previous Owner | Gonzalez Paul A | $25,200 |
Source: Public Records
Tax History Compared to Growth
Tax History
| Year | Tax Paid | Tax Assessment Tax Assessment Total Assessment is a certain percentage of the fair market value that is determined by local assessors to be the total taxable value of land and additions on the property. | Land | Improvement |
|---|---|---|---|---|
| 2025 | $4,047 | $625,000 | $108,918 | $516,082 |
| 2024 | $4,048 | $619,388 | -- | -- |
| 2023 | $4,048 | $563,080 | $108,920 | $471,080 |
| 2022 | $9,033 | $511,890 | $108,920 | $503,790 |
| 2021 | $8,649 | $465,350 | $80,680 | $384,670 |
| 2020 | $8,680 | $428,900 | $80,680 | $348,220 |
| 2019 | $8,859 | $439,890 | $80,680 | $359,210 |
| 2018 | $9,352 | $505,310 | $40,340 | $498,460 |
| 2017 | $9,741 | $459,370 | $40,340 | $419,030 |
| 2016 | $8,968 | $422,920 | $40,340 | $387,820 |
| 2015 | $6,418 | $384,470 | $40,340 | $344,130 |
| 2014 | $6,418 | $350,340 | $40,340 | $319,700 |
Source: Public Records
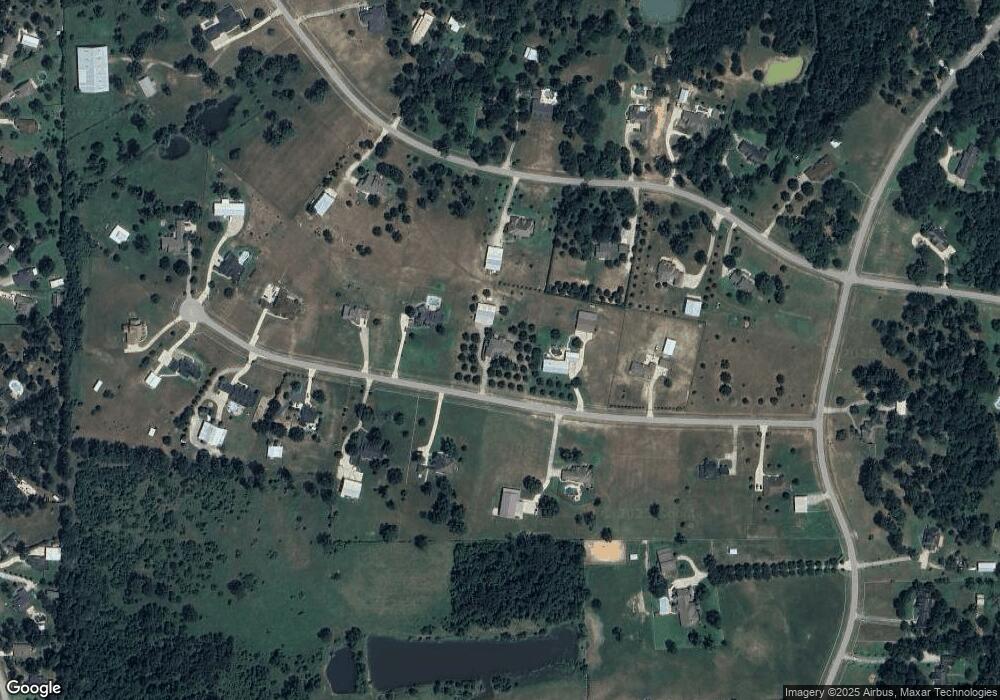
Map
Nearby Homes
- 34310 High Point Dr
- 32210 Park Meadow Pass
- 21706 Whielden Heights Way
- 21710 Whielden Heights Way
- 21738 Whielden Heights Way
- 19135 Ranchcrest Dr
- 21742 Whielden Heights Way
- 19016 Magnolia Willow Ln
- 32127 River Park Dr
- 21210 Natalia Grove
- Hanford Plan at Emory Glen
- Davenport Plan at Emory Glen
- Fordham Plan at Emory Glen
- Kingston Plan at Emory Glen
- Surrey Plan at Emory Glen
- Brent Plan at Emory Glen
- Redford Plan at Emory Glen
- Middleton Plan at Emory Glen
- Yorktown Plan at Emory Glen
- Grafton Plan at Emory Glen
- 34126 Sanders Ranch Rd
- 34210 Sanders Ranch Rd
- 34135 High Point Dr
- 34127 High Point Dr
- 34203 Sanders Ranch Rd
- 34218 Sanders Ranch Rd
- 34118 Sanders Ranch Rd
- 34127 Sanders Ranch Rd
- 34211 Sanders Ranch Rd
- 34119 High Point Dr
- 34211 High Point Dr
- 34219 Sanders Ranch Rd
- 34226 Sanders Ranch Rd
- 34134 High Point Dr
- 34103 High Point Dr
- 34111 Sanders Ranch Rd
- 34126 High Point Dr
- LOT29 High Point Dr
- 29-B High Point Dr
- Lot 26 High Point Dr