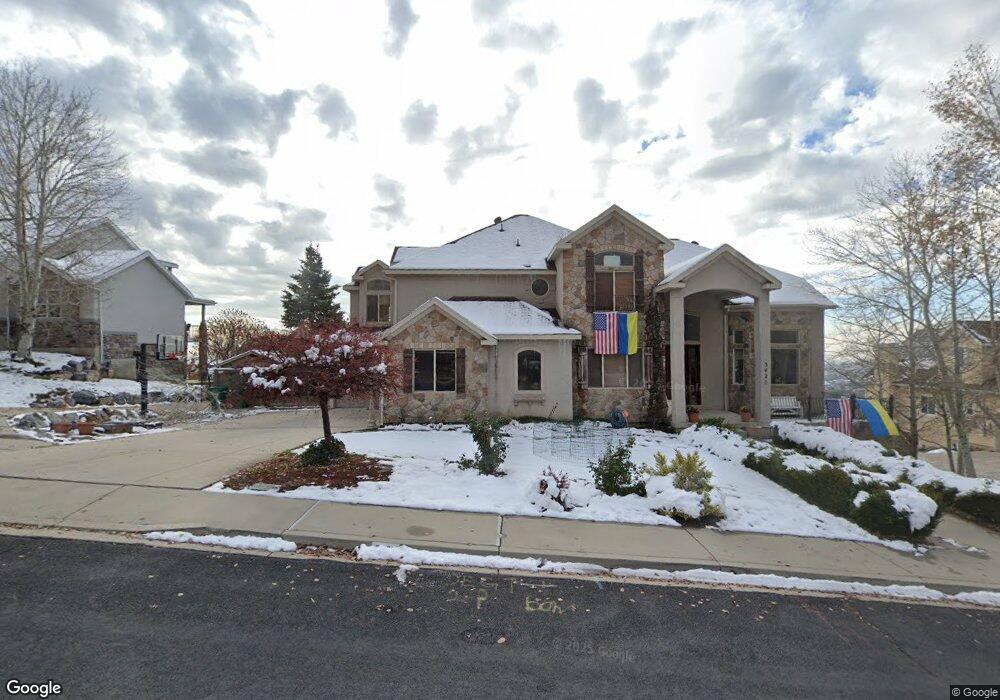
3421 Bear Canyon Ln Unit 76 Cedar Hills, UT 84062
Estimated Value: $1,027,000 - $1,206,000
4
Beds
5
Baths
3,307
Sq Ft
$341/Sq Ft
Est. Value
About This Home
This home is located at 3421 Bear Canyon Ln Unit 76, Cedar Hills, UT 84062 and is currently estimated at $1,127,949, approximately $341 per square foot. 3421 Bear Canyon Ln Unit 76 is a home located in Utah County with nearby schools including Deerfield Elementary School, Mountain Ridge Junior High School, and American Fork High School.
Ownership History
Date
Name
Owned For
Owner Type
Purchase Details
Closed on
Mar 27, 2019
Sold by
Budge Monica
Bought by
Rose Charlton
Current Estimated Value
Home Financials for this Owner
Home Financials are based on the most recent Mortgage that was taken out on this home.
Original Mortgage
$484,350
Outstanding Balance
$425,830
Interest Rate
4.3%
Mortgage Type
New Conventional
Estimated Equity
$702,119
Purchase Details
Closed on
Mar 29, 2002
Sold by
Sovereign Homes Inc
Bought by
Budge Lowell Jared and Budge Monica
Home Financials for this Owner
Home Financials are based on the most recent Mortgage that was taken out on this home.
Original Mortgage
$330,000
Interest Rate
6.84%
Mortgage Type
Construction
Purchase Details
Closed on
May 31, 2000
Sold by
Legacy Properties & Investments Lc
Bought by
Sovereign Homes Inc
Home Financials for this Owner
Home Financials are based on the most recent Mortgage that was taken out on this home.
Original Mortgage
$312,000
Interest Rate
8.18%
Create a Home Valuation Report for This Property
The Home Valuation Report is an in-depth analysis detailing your home's value as well as a comparison with similar homes in the area
Home Values in the Area
Average Home Value in this Area
Purchase History
| Date | Buyer | Sale Price | Title Company |
|---|---|---|---|
| Rose Charlton | -- | Inwest Title | |
| Budge Lowell Jared | -- | Backman Stewart Title Servic | |
| Sovereign Homes Inc | -- | First American Title Co |
Source: Public Records
Mortgage History
| Date | Status | Borrower | Loan Amount |
|---|---|---|---|
| Open | Rose Charlton | $484,350 | |
| Previous Owner | Budge Lowell Jared | $330,000 | |
| Previous Owner | Sovereign Homes Inc | $312,000 |
Source: Public Records
Tax History Compared to Growth
Tax History
| Year | Tax Paid | Tax Assessment Tax Assessment Total Assessment is a certain percentage of the fair market value that is determined by local assessors to be the total taxable value of land and additions on the property. | Land | Improvement |
|---|---|---|---|---|
| 2025 | $4,099 | $1,029,600 | $324,400 | $705,200 |
| 2024 | $4,099 | $485,375 | $0 | $0 |
| 2023 | $3,732 | $474,815 | $0 | $0 |
| 2022 | $4,143 | $514,965 | $0 | $0 |
| 2021 | $3,743 | $692,900 | $211,000 | $481,900 |
| 2020 | $3,463 | $625,700 | $195,400 | $430,300 |
| 2019 | $2,643 | $495,900 | $182,900 | $313,000 |
| 2018 | $2,723 | $481,300 | $182,900 | $298,400 |
| 2017 | $2,704 | $255,585 | $0 | $0 |
| 2016 | $2,908 | $255,585 | $0 | $0 |
| 2015 | $3,017 | $251,020 | $0 | $0 |
| 2014 | $2,749 | $227,150 | $0 | $0 |
Source: Public Records
Map
Nearby Homes
- 3408 W Bear Canyon Ln N Unit 53
- 3373 Bear Canyon Ln
- 9078 Renaissance Dr
- 9157 N Canyon Heights Dr
- 8944 Silver Lake Dr
- 2832 N 550 W
- 2837 N 550 W
- 9481 N 3830 W
- 532 W 2000 N
- 9575 Aztec Dr
- 1726 N Siena Cir Unit 10
- 1727 N Siena Cir Unit 4
- 1656 N Siena Cir Unit 7
- 2969 N 1350 W
- 1897 N 900 W
- 429 E 1600 N
- 980 W 1800 N
- 712 W 1590 N
- 731 W 1590 N Unit 15
- 1534 N 750 W Unit 16
- 3421 Bear Canyon Ln
- 3437 Bear Canyon Ln
- 3407 Bear Canyon Ln Unit 75
- 3407 Bear Canyon Ln
- 8966 N Pine Hollow Dr
- 8966 Pine Hollow Dr
- 9028 N Mill Creek Cove
- 8956 Pine Hollow Dr
- 3449 Bear Canyon Ln
- 8974 Pine Hollow Dr
- 8974 N Pine Hollow Dr
- 3391 Bear Canyon Ln Unit 74
- 3391 Bear Canyon Ln
- 8948 N Pine Hollow Dr
- 8948 Pine Hollow Dr
- 8994 Forest Lake Cir
- 9038 N Mill Creek Cove
- 8980 Pine Hollow Dr
- 8980 N Pine Hollow Dr
- 9035 Mill Creek Cove