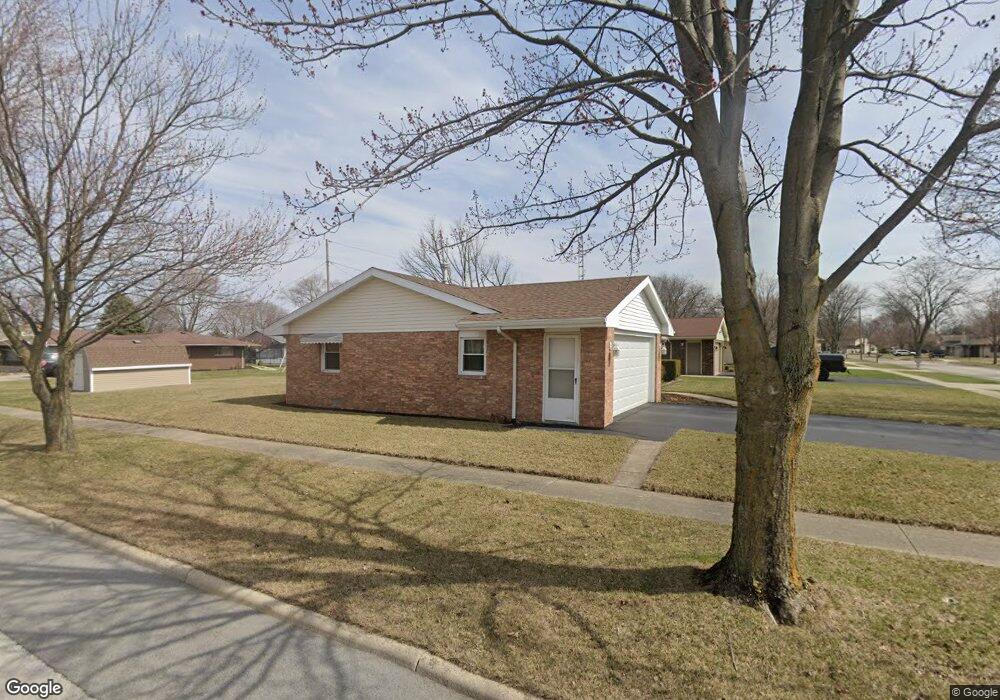
3421 Norcrest St Findlay, OH 45840
Estimated Value: $212,000 - $224,000
3
Beds
2
Baths
1,260
Sq Ft
$173/Sq Ft
Est. Value
About This Home
This home is located at 3421 Norcrest St, Findlay, OH 45840 and is currently estimated at $217,574, approximately $172 per square foot. 3421 Norcrest St is a home located in Hancock County with nearby schools including Bigelow Hill Elementary School, Northview Elementary School, and Glenwood Middle School.
Ownership History
Date
Name
Owned For
Owner Type
Purchase Details
Closed on
Jun 7, 2019
Sold by
Gonyer Anthony M
Bought by
Gonyer Anthony M and Anthony M Gonyer Rev Inter Vivos Tr
Current Estimated Value
Purchase Details
Closed on
Jun 19, 2006
Sold by
Wade Gerald E
Bought by
Gonyer Anthony M
Purchase Details
Closed on
Oct 12, 2005
Sold by
Estate Of Saundra S Wade
Bought by
Wade Gerald E
Create a Home Valuation Report for This Property
The Home Valuation Report is an in-depth analysis detailing your home's value as well as a comparison with similar homes in the area
Home Values in the Area
Average Home Value in this Area
Purchase History
| Date | Buyer | Sale Price | Title Company |
|---|---|---|---|
| Gonyer Anthony M | -- | None Available | |
| Gonyer Anthony M | $135,000 | Mid Am Title Agency | |
| Wade Gerald E | -- | -- |
Source: Public Records
Tax History
| Year | Tax Paid | Tax Assessment Tax Assessment Total Assessment is a certain percentage of the fair market value that is determined by local assessors to be the total taxable value of land and additions on the property. | Land | Improvement |
|---|---|---|---|---|
| 2024 | $2,174 | $61,200 | $9,160 | $52,040 |
| 2023 | $2,178 | $61,200 | $9,160 | $52,040 |
| 2022 | $2,170 | $61,200 | $9,160 | $52,040 |
| 2021 | $2,020 | $49,610 | $9,180 | $40,430 |
| 2020 | $2,019 | $49,610 | $9,180 | $40,430 |
| 2019 | $1,979 | $49,610 | $9,180 | $40,430 |
| 2018 | $1,774 | $40,810 | $7,060 | $33,750 |
| 2017 | $1,775 | $40,810 | $7,060 | $33,750 |
| 2016 | $1,753 | $40,810 | $7,060 | $33,750 |
| 2015 | $1,801 | $41,180 | $7,060 | $34,120 |
| 2014 | $1,801 | $41,180 | $7,060 | $34,120 |
| 2012 | $1,814 | $41,180 | $7,060 | $34,120 |
Source: Public Records
Map
Nearby Homes
- 3315 Norcrest St
- 323 W Bigelow Ave
- 3239 N Main St
- 0 Township Highway 99
- 12325 Township Highway 99
- 3237 Gleneagle Dr
- 201 Bell Ave
- 227 Terrace Dr
- 400 Rosewood Ave
- 3018 Gleneagle Dr
- 2604 N Main St
- 128 Harrington Ave
- 0 Allen Township 142
- 3106 Saddlebrook
- 636 W Melrose Ave
- 701 W Melrose Ave
- 329 W Melrose Ave
- 315 W Melrose Ave
- 724 Edith Ave
- 4417 County Road 220
- 3415 Norcrest St
- 3413 Crosshill Dr
- 3407 Norcrest St
- 3404 Crosshill Dr
- 3321 Crosshill Dr
- 3400 Crosshill Dr
- 417 Hillshafer Dr
- 3401 Norcrest St
- 413 Hillshafer Dr
- 3324 Edgemont Dr
- 3414 Crosshill Dr
- 3315 Crosshill Dr
- 3316 Crosshill Dr
- 3331 Norcrest St
- 3420 Crosshill Dr
- 3320 Edgemont Dr
- 409 Hillshafer Dr
- 3314 Crosshill Dr
- 3309 Crosshill Dr
- 424 Hillshafer Dr
Your Personal Tour Guide
Ask me questions while you tour the home.