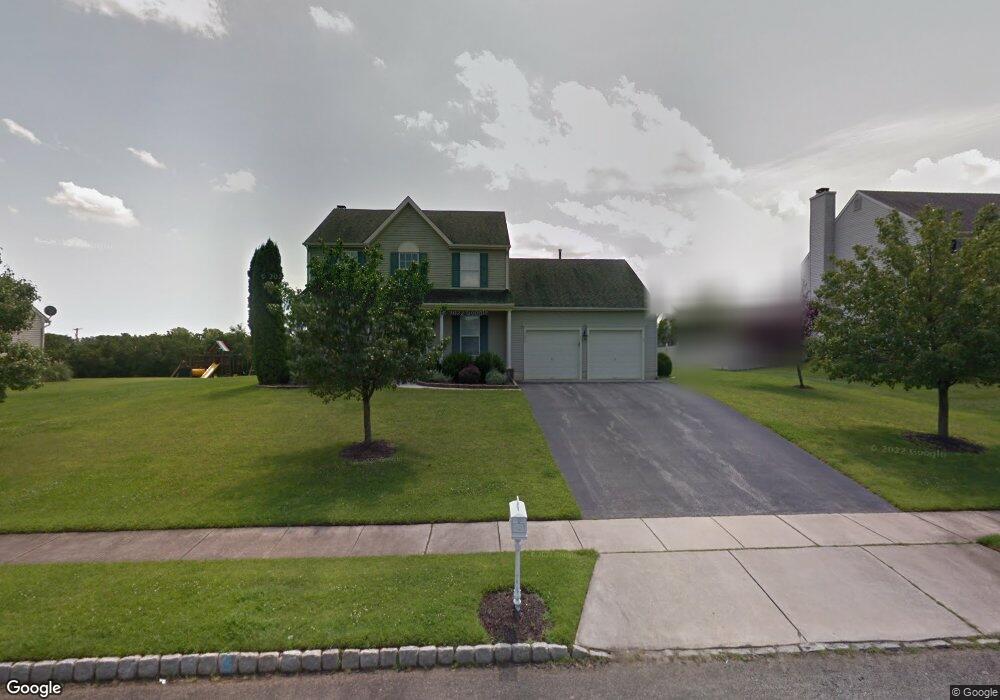
3421 Siena Way Vineland, NJ 08361
Estimated Value: $422,000 - $490,000
--
Bed
--
Bath
1,832
Sq Ft
$247/Sq Ft
Est. Value
About This Home
This home is located at 3421 Siena Way, Vineland, NJ 08361 and is currently estimated at $452,265, approximately $246 per square foot. 3421 Siena Way is a home located in Cumberland County with nearby schools including Anthony Rossi Elementary School, Pauline J. Petway Elementary School, and Vineland Senior High School.
Ownership History
Date
Name
Owned For
Owner Type
Purchase Details
Closed on
Oct 16, 2025
Sold by
Orazi Kathleen
Bought by
Orazi Kathleen and Orazi Joseph M
Current Estimated Value
Purchase Details
Closed on
Jan 31, 2018
Sold by
Orazi Kathleen and Allen Jean C
Bought by
Orazi Kathleen
Home Financials for this Owner
Home Financials are based on the most recent Mortgage that was taken out on this home.
Original Mortgage
$190,000
Interest Rate
3.95%
Mortgage Type
Purchase Money Mortgage
Purchase Details
Closed on
Jan 16, 2008
Sold by
Feltes Jeffrey E and Feltes Desiree M
Bought by
Allen Jean C
Purchase Details
Closed on
Jul 31, 2000
Sold by
Ironwood Building Co
Bought by
Feltes Jeffery E and Feltes Desiree M
Home Financials for this Owner
Home Financials are based on the most recent Mortgage that was taken out on this home.
Original Mortgage
$124,900
Interest Rate
8.1%
Create a Home Valuation Report for This Property
The Home Valuation Report is an in-depth analysis detailing your home's value as well as a comparison with similar homes in the area
Home Values in the Area
Average Home Value in this Area
Purchase History
| Date | Buyer | Sale Price | Title Company |
|---|---|---|---|
| Orazi Kathleen | -- | None Listed On Document | |
| Orazi Kathleen | $184,500 | -- | |
| Allen Jean C | $265,000 | -- | |
| Feltes Jeffery E | $156,150 | -- |
Source: Public Records
Mortgage History
| Date | Status | Borrower | Loan Amount |
|---|---|---|---|
| Previous Owner | Orazi Kathleen | $190,000 | |
| Previous Owner | Feltes Jeffery E | $124,900 |
Source: Public Records
Tax History Compared to Growth
Tax History
| Year | Tax Paid | Tax Assessment Tax Assessment Total Assessment is a certain percentage of the fair market value that is determined by local assessors to be the total taxable value of land and additions on the property. | Land | Improvement |
|---|---|---|---|---|
| 2025 | $7,393 | $232,200 | $49,500 | $182,700 |
| 2024 | $7,393 | $232,200 | $49,500 | $182,700 |
| 2023 | $7,344 | $232,200 | $49,500 | $182,700 |
| 2022 | $7,126 | $232,200 | $49,500 | $182,700 |
| 2021 | $6,996 | $232,200 | $49,500 | $182,700 |
| 2020 | $6,796 | $232,200 | $49,500 | $182,700 |
| 2019 | $6,704 | $232,200 | $49,500 | $182,700 |
| 2018 | $6,527 | $232,200 | $49,500 | $182,700 |
| 2017 | $6,200 | $232,200 | $49,500 | $182,700 |
| 2016 | $5,981 | $232,200 | $49,500 | $182,700 |
| 2015 | $5,761 | $232,200 | $49,500 | $182,700 |
| 2014 | $5,447 | $232,200 | $49,500 | $182,700 |
Source: Public Records
Map
Nearby Homes
- 3391 Venturi Ln
- 1880 S Brookfield St
- 1535 Bear Branch Ct
- 2151 S Brookfield St
- 4024 Renee Dr
- 2851 Crane St
- 2769 Dante Ave
- 2564 Edna Dr
- 2551 Edna Dr
- 1197 S Lincoln Ave
- 3773 Brookhaven Dr
- 1730 Junior Dr
- 2354 Dante Ave
- 1319 Paterson Dr
- 3176 Hance Bridge Rd
- 2603 Valhalla Rd
- 2676 Medina St
- 1154 Mcclain Dr
- 3070 E Chestnut Ave
- 2810 Panther Rd
- 3401 Siena Way
- 3441 Siena Way
- 3410 Siena Way
- 3381 Siena Way
- 3440 Siena Way
- 3400 Siena Way
- 3461 Siena Way
- 3380 Siena Way
- 3452 Tuttlegrove Rd
- 3418 Tuttlegrove Rd
- 3470 Tuttlegrove Rd
- 3494 Tuttlegrove Rd
- 3460 Siena Way
- 3361 Siena Way
- 3417 Tuttlegrove Rd
- 1407 Whispering Woods Way
- 1387 Whispering Woods Way
- 1427 Whispering Woods Way
- 3360 Siena Way
- 3300 Tuttlegrove Rd