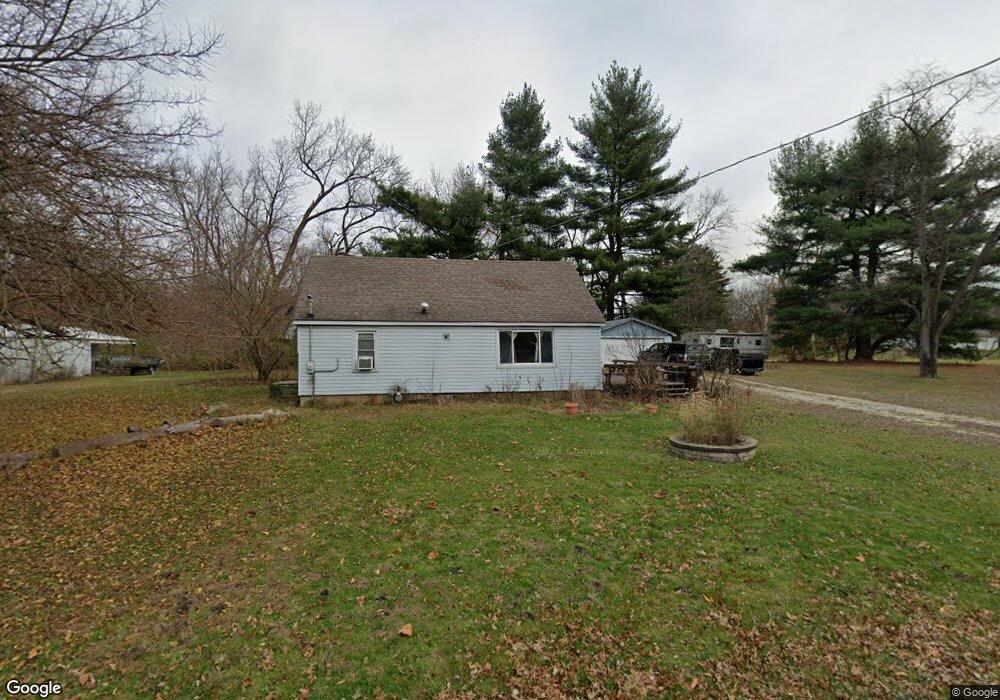
34211 S Lakeside Terrace Wilmington, IL 60481
Estimated Value: $148,000 - $269,000
2
Beds
1
Bath
900
Sq Ft
$225/Sq Ft
Est. Value
About This Home
This home is located at 34211 S Lakeside Terrace, Wilmington, IL 60481 and is currently estimated at $202,888, approximately $225 per square foot. 34211 S Lakeside Terrace is a home located in Will County with nearby schools including Bruning Elementary School, L.J. Stevens Intermediate School, and Wilmington Middle School.
Ownership History
Date
Name
Owned For
Owner Type
Purchase Details
Closed on
Sep 28, 2017
Sold by
Richardson Christopher
Bought by
Kane James R O
Current Estimated Value
Home Financials for this Owner
Home Financials are based on the most recent Mortgage that was taken out on this home.
Original Mortgage
$97,979
Outstanding Balance
$82,766
Interest Rate
4.25%
Mortgage Type
New Conventional
Estimated Equity
$120,122
Purchase Details
Closed on
Dec 12, 2000
Sold by
Rodgers Darrell J and Rodgers Dawn L
Bought by
Richardson Christopher M
Home Financials for this Owner
Home Financials are based on the most recent Mortgage that was taken out on this home.
Original Mortgage
$79,000
Interest Rate
7.83%
Purchase Details
Closed on
Dec 13, 1996
Sold by
Rodgers Darrell J and Hammen Dawn L
Bought by
Rodgers Darrell J and Rodgers Dawn L
Home Financials for this Owner
Home Financials are based on the most recent Mortgage that was taken out on this home.
Original Mortgage
$60,400
Interest Rate
10.37%
Create a Home Valuation Report for This Property
The Home Valuation Report is an in-depth analysis detailing your home's value as well as a comparison with similar homes in the area
Home Values in the Area
Average Home Value in this Area
Purchase History
| Date | Buyer | Sale Price | Title Company |
|---|---|---|---|
| Kane James R O | $97,000 | Fidelity National Title Ins | |
| Richardson Christopher M | $84,000 | -- | |
| Rodgers Darrell J | -- | -- |
Source: Public Records
Mortgage History
| Date | Status | Borrower | Loan Amount |
|---|---|---|---|
| Open | Kane James R O | $97,979 | |
| Previous Owner | Richardson Christopher M | $79,000 | |
| Previous Owner | Rodgers Darrell J | $60,400 |
Source: Public Records
Tax History Compared to Growth
Tax History
| Year | Tax Paid | Tax Assessment Tax Assessment Total Assessment is a certain percentage of the fair market value that is determined by local assessors to be the total taxable value of land and additions on the property. | Land | Improvement |
|---|---|---|---|---|
| 2024 | $3,158 | $55,378 | $32,427 | $22,951 |
| 2023 | $3,158 | $54,533 | $31,932 | $22,601 |
| 2022 | $2,995 | $49,985 | $29,269 | $20,716 |
| 2021 | $2,732 | $45,137 | $26,430 | $18,707 |
| 2020 | $2,607 | $42,683 | $24,993 | $17,690 |
| 2019 | $2,606 | $42,683 | $24,993 | $17,690 |
| 2018 | $2,621 | $42,683 | $24,993 | $17,690 |
| 2017 | $2,606 | $42,319 | $24,780 | $17,539 |
| 2016 | $2,456 | $40,528 | $23,731 | $16,797 |
| 2015 | $2,337 | $38,397 | $22,483 | $15,914 |
| 2014 | $2,337 | $37,644 | $22,042 | $15,602 |
| 2013 | $2,337 | $37,644 | $22,042 | $15,602 |
Source: Public Records
Map
Nearby Homes
- 21741 W Grand Ave
- 5 Elmwood Ave
- 8 Elmwood Ave
- 2 Elmwood Ave
- Lot 26-33 Hickory Ave
- Lot 9-13 Hickory Ave
- 14 Hickory Ave
- 21860 Illinois 113
- 2032 Roberts St
- 1953 Lakewood Dr
- 1923 Bruning Dr
- 20340 Illinois 113
- 18140 Illinois 113
- 21439 Illinois 113
- 17707 Illinois 113
- 0000 Illinois 113
- 2005 Roberts St
- 20684 Illinois 102
- 21244 Illinois 113
- 1530 Vista Dr
- 34201 S Lakeside Terrace
- 34156 S Greenwood St
- 34224 S Lakeside Terrace
- 34205 Greenwood St
- 34216 S Lakeside Terrace
- 34208 S Lakeside Terrace
- 34212 S Lakeside Terrace
- 34204 S Lakeside Terrace
- 34156 Greenwood St
- 34230 S Lakeside Terrace
- 34237 S Lakeside Terrace
- 34153 S Lakeside Terrace
- 34241 S Lakeside Terrace
- 34234 S Lakeside Terrace
- 34234 S Lakeside Terrace
- 34161 Greenwood St
- 34220 S Rosewood St
- 34220 S Rosewood St
- 34238 S Lakeside Terrace
- 34244 S Lakeside Terrace