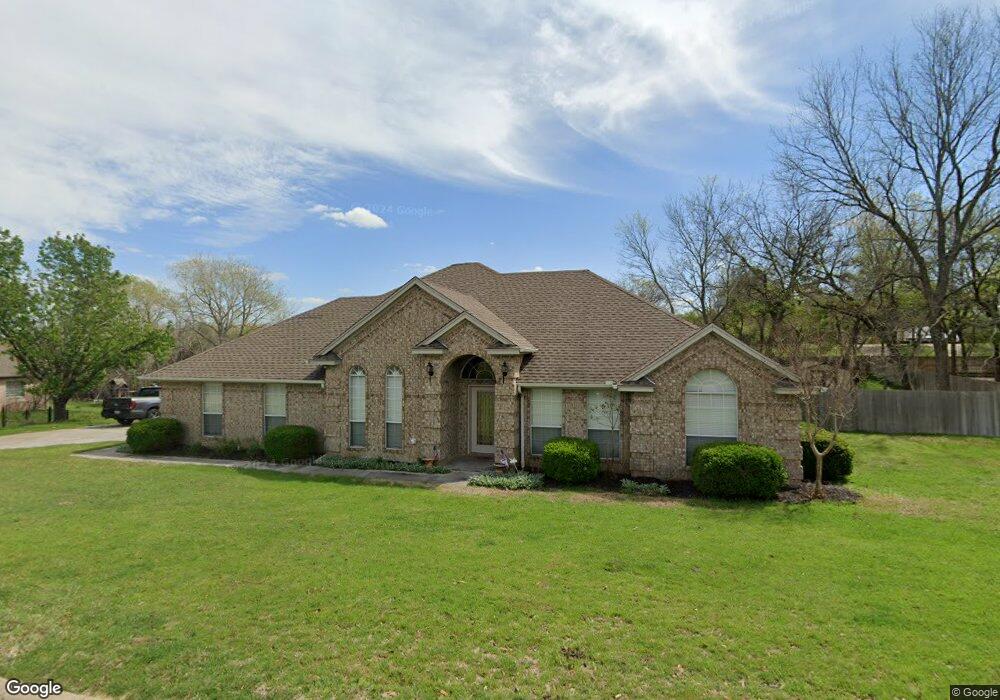
3422 Cliff View Loop Weatherford, TX 76087
Estimated Value: $443,000 - $476,000
--
Bed
--
Bath
2,006
Sq Ft
$230/Sq Ft
Est. Value
About This Home
This home is located at 3422 Cliff View Loop, Weatherford, TX 76087 and is currently estimated at $462,131, approximately $230 per square foot. 3422 Cliff View Loop is a home located in Parker County with nearby schools including Martin Elementary School, Tison Middle School, and Weatherford High School.
Ownership History
Date
Name
Owned For
Owner Type
Purchase Details
Closed on
Feb 21, 2006
Sold by
Cranford Kelly P
Bought by
Norris James and Norris Tammy
Current Estimated Value
Home Financials for this Owner
Home Financials are based on the most recent Mortgage that was taken out on this home.
Original Mortgage
$156,000
Outstanding Balance
$87,039
Interest Rate
6.05%
Mortgage Type
New Conventional
Estimated Equity
$375,092
Purchase Details
Closed on
Sep 15, 2005
Sold by
Cranford Medina
Bought by
Cranford Kelly P
Purchase Details
Closed on
Aug 20, 2001
Sold by
Wtf Custom Homes Inc
Bought by
Norris James and Norris Tammy
Purchase Details
Closed on
Oct 11, 2000
Sold by
Lake Weatherford Dev Partners
Bought by
Norris James and Norris Tammy
Purchase Details
Closed on
Jan 1, 1901
Bought by
Norris James and Norris Tammy
Create a Home Valuation Report for This Property
The Home Valuation Report is an in-depth analysis detailing your home's value as well as a comparison with similar homes in the area
Home Values in the Area
Average Home Value in this Area
Purchase History
| Date | Buyer | Sale Price | Title Company |
|---|---|---|---|
| Norris James | -- | None Available | |
| Cranford Kelly P | -- | None Available | |
| Norris James | -- | -- | |
| Norris James | -- | -- | |
| Norris James | -- | -- |
Source: Public Records
Mortgage History
| Date | Status | Borrower | Loan Amount |
|---|---|---|---|
| Open | Norris James | $156,000 |
Source: Public Records
Tax History Compared to Growth
Tax History
| Year | Tax Paid | Tax Assessment Tax Assessment Total Assessment is a certain percentage of the fair market value that is determined by local assessors to be the total taxable value of land and additions on the property. | Land | Improvement |
|---|---|---|---|---|
| 2025 | $6,029 | $428,208 | -- | -- |
| 2024 | $6,029 | $366,553 | -- | -- |
| 2023 | $6,029 | $333,230 | $0 | $0 |
| 2022 | $6,720 | $302,940 | $30,000 | $272,940 |
| 2021 | $7,275 | $302,940 | $30,000 | $272,940 |
| 2020 | $6,790 | $281,000 | $30,000 | $251,000 |
| 2019 | $6,684 | $281,000 | $30,000 | $251,000 |
| 2018 | $6,104 | $237,960 | $30,000 | $207,960 |
| 2017 | $6,067 | $237,960 | $30,000 | $207,960 |
| 2016 | $5,515 | $209,610 | $30,000 | $179,610 |
| 2015 | $5,032 | $209,610 | $30,000 | $179,610 |
| 2014 | $4,720 | $196,300 | $30,000 | $166,300 |
Source: Public Records
Map
Nearby Homes
- 3409 Foot Hills Dr
- 3210 Bluebonnet Cir
- 3509 Lakeshore Dr
- 3609 Marina Link
- 3610 Lakeshore Dr
- 602 Valley Trail Dr
- 3616 Overlook Manor
- 221 Valley Ranch Rd
- 408 Canyon Trail Rd
- 3503 Red Bud Dr
- 3806 Lakeshore Dr
- 318 W Lake Dr
- 106 Winfield St
- 3708 Oak Park Dr Unit A
- 3703 Pecan Park Dr
- 302 Red Eagle Trail
- 1317 Thistle Hill Trail
- 2911 Inspiration Dr
- 1025 Gannon Valley Trail
- 1029 Brown Valley Trail
- 3418 Cliff View Loop
- 3426 Cliff View Loop
- 3417 Cliff View Loop
- 3410 Stage Coach Trail
- 3421 Cliff View Loop
- 3504 Stage Coach Trail
- 3430 Cliff View Loop
- 3414 Cliff View Loop
- 3408 Stage Coach Trail
- 3506 Stage Coach Trail
- 3405 Creek Crossing Dr
- 3413 Cliff View Loop
- 3425 Cliff View Loop
- 3404 Creek Crossing Dr
- 3410 Cliff View Loop
- 3313 Bluebonnet Cir
- 3434 Cliff View Loop
- 3406 Stage Coach Trail
- 3307 Bluebonnet Cir
- 3409 Cliff View Loop