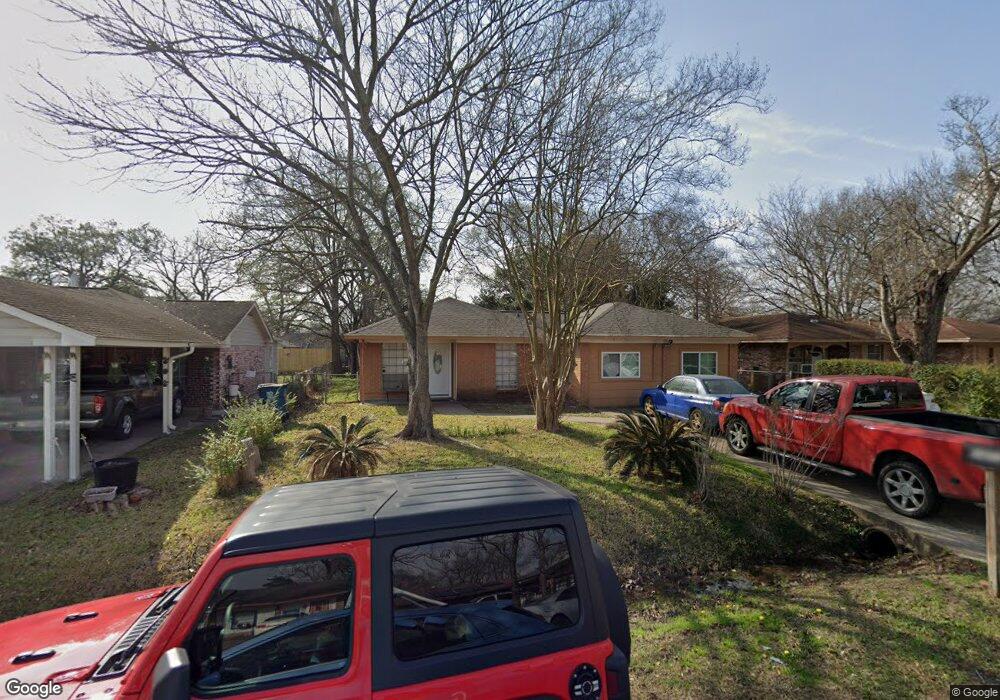
3422 Hartwick Rd Houston, TX 77093
East Aldine NeighborhoodEstimated Value: $139,000 - $164,000
3
Beds
2
Baths
977
Sq Ft
$158/Sq Ft
Est. Value
About This Home
This home is located at 3422 Hartwick Rd, Houston, TX 77093 and is currently estimated at $154,343, approximately $157 per square foot. 3422 Hartwick Rd is a home located in Harris County with nearby schools including Vardeman EC/PK/K, Worsham Elementary School, and Macarthur Ninth Grade School.
Ownership History
Date
Name
Owned For
Owner Type
Purchase Details
Closed on
Apr 6, 2020
Sold by
Herrera Hector A and Flores Marla Elena
Bought by
Douglas Lawrence C
Current Estimated Value
Home Financials for this Owner
Home Financials are based on the most recent Mortgage that was taken out on this home.
Original Mortgage
$120,000
Outstanding Balance
$106,305
Interest Rate
3.4%
Mortgage Type
New Conventional
Estimated Equity
$48,038
Purchase Details
Closed on
Sep 18, 2014
Sold by
Heywood Mariana E
Bought by
Flores Maria Elena
Purchase Details
Closed on
Oct 12, 2013
Sold by
Sanchez Maria and Sanchez Eric
Bought by
Herrera Hector A and Herrera Mariana E
Purchase Details
Closed on
May 25, 2006
Sold by
Owens Donald E
Bought by
Sanchez Eric and Sanchez Maria S
Purchase Details
Closed on
Oct 25, 2003
Sold by
Mraz Maria
Bought by
Owens Jr Donald E
Create a Home Valuation Report for This Property
The Home Valuation Report is an in-depth analysis detailing your home's value as well as a comparison with similar homes in the area
Home Values in the Area
Average Home Value in this Area
Purchase History
| Date | Buyer | Sale Price | Title Company |
|---|---|---|---|
| Douglas Lawrence C | -- | None Available | |
| Flores Maria Elena | -- | None Available | |
| Herrera Hector A | -- | None Available | |
| Sanchez Eric | -- | Commonwealth Title | |
| Owens Jr Donald E | -- | -- |
Source: Public Records
Mortgage History
| Date | Status | Borrower | Loan Amount |
|---|---|---|---|
| Open | Douglas Lawrence C | $120,000 |
Source: Public Records
Tax History Compared to Growth
Tax History
| Year | Tax Paid | Tax Assessment Tax Assessment Total Assessment is a certain percentage of the fair market value that is determined by local assessors to be the total taxable value of land and additions on the property. | Land | Improvement |
|---|---|---|---|---|
| 2025 | $2,571 | $153,290 | $43,930 | $109,360 |
| 2024 | $2,571 | $132,887 | $43,930 | $88,957 |
| 2023 | $2,571 | $176,057 | $30,720 | $145,337 |
| 2022 | $2,874 | $139,770 | $30,720 | $109,050 |
| 2021 | $2,402 | $111,436 | $30,720 | $80,716 |
| 2020 | $2,261 | $99,513 | $30,720 | $68,793 |
| 2019 | $2,181 | $91,685 | $30,720 | $60,965 |
| 2018 | $1,077 | $75,002 | $14,746 | $60,256 |
| 2017 | $1,700 | $75,002 | $14,746 | $60,256 |
| 2016 | $1,700 | $75,002 | $14,746 | $60,256 |
| 2015 | $1,292 | $72,547 | $14,746 | $57,801 |
| 2014 | $1,292 | $57,934 | $14,746 | $43,188 |
Source: Public Records
Map
Nearby Homes
- 3111 Hartwick Rd
- 3214 Brea Crest St
- 2915 Brea Crest St
- 4007 Wedgewood St
- 3418 Hopper Rd
- 4415 Mooney Rd
- 2723 Castledale Dr
- 11769 Gloger St
- 2817 Cromwell St
- 9213 Washington St
- 3804 Cedar Hill Ln
- 4522 Collins Rd
- 11716 Innsbury Dr
- 2410 Mierianne St
- 11206 Eastex Fwy
- 2629 Kowis St
- 11746 Somerset Ln
- 4410 Shelton Rd
- 2311 Warwick Rd
- 2326 Sunny Dr
- 3426 Hartwick Rd
- 3418 Hartwick Rd
- 3430 Hartwick Rd
- 3414 Hartwick Rd
- 3419 Havner Ln
- 3423 Havner Ln
- 3415 Havner Ln
- 3427 Havner Ln
- 3423 Hartwick Rd
- 3502 Hartwick Rd
- 3427 Hartwick Rd
- 3410 Hartwick Rd
- 3419 Hartwick Rd
- 3411 Havner Ln
- 3503 Havner Ln
- 3431 Hartwick Rd
- 3506 Hartwick Rd
- 3406 Hartwick Rd
- 3503 Hartwick Rd
- 3407 Havner Ln