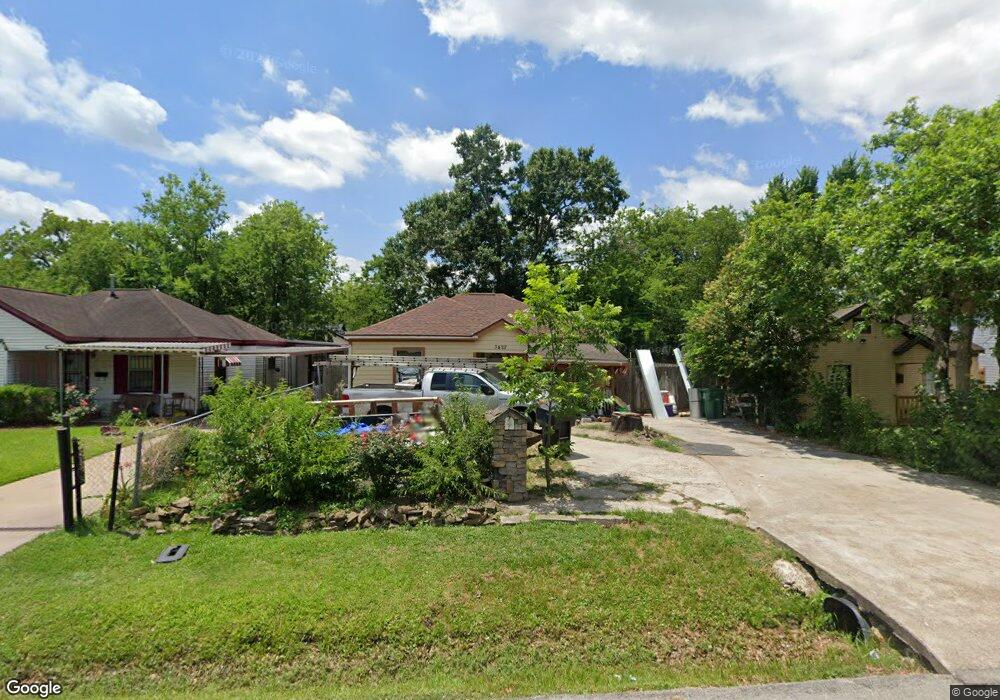
3422 Noah St Houston, TX 77021
OST-South Union NeighborhoodEstimated Value: $133,000 - $179,594
3
Beds
1
Bath
871
Sq Ft
$178/Sq Ft
Est. Value
About This Home
This home is located at 3422 Noah St, Houston, TX 77021 and is currently estimated at $155,399, approximately $178 per square foot. 3422 Noah St is a home located in Harris County with nearby schools including Whidby Elementary School, Cullen Middle School, and Yates High School.
Ownership History
Date
Name
Owned For
Owner Type
Purchase Details
Closed on
Jun 11, 2013
Sold by
Luna Jose Salvador
Bought by
Lopez Gonzalez Mauro and Gonzales Matus Maria Eugenia
Current Estimated Value
Purchase Details
Closed on
Oct 6, 2009
Sold by
Pareja Juan
Bought by
Luna Salvador Jose
Purchase Details
Closed on
Jul 1, 2009
Sold by
Washington Johnnie M
Bought by
Pareja Juan
Purchase Details
Closed on
Jan 16, 2003
Sold by
Heckard Bobbie
Bought by
Pareja Juan
Create a Home Valuation Report for This Property
The Home Valuation Report is an in-depth analysis detailing your home's value as well as a comparison with similar homes in the area
Home Values in the Area
Average Home Value in this Area
Purchase History
| Date | Buyer | Sale Price | Title Company |
|---|---|---|---|
| Lopez Gonzalez Mauro | -- | None Available | |
| Luna Salvador Jose | -- | Fidelity National Title | |
| Pareja Juan | -- | None Available | |
| Pareja Juan | -- | None Available | |
| Heckard Bobbie | -- | None Available |
Source: Public Records
Tax History
| Year | Tax Paid | Tax Assessment Tax Assessment Total Assessment is a certain percentage of the fair market value that is determined by local assessors to be the total taxable value of land and additions on the property. | Land | Improvement |
|---|---|---|---|---|
| 2025 | $3,849 | $167,783 | $105,000 | $62,783 |
| 2024 | $3,849 | $183,934 | $100,000 | $83,934 |
| 2023 | $3,706 | $183,934 | $100,000 | $83,934 |
| 2022 | $3,524 | $160,051 | $80,000 | $80,051 |
| 2021 | $2,610 | $111,996 | $33,750 | $78,246 |
| 2020 | $1,974 | $81,536 | $33,750 | $47,786 |
| 2019 | $1,860 | $73,499 | $30,000 | $43,499 |
| 2018 | $1,503 | $59,411 | $15,000 | $44,411 |
| 2017 | $1,502 | $59,411 | $15,000 | $44,411 |
| 2016 | $1,376 | $54,413 | $15,000 | $39,413 |
| 2015 | $1,287 | $50,048 | $15,000 | $35,048 |
| 2014 | $1,287 | $50,048 | $15,000 | $35,048 |
Source: Public Records
Map
Nearby Homes
- 3437 Seabrook St
- 3441 Goodhope St
- 0 Mount Pleasant St
- 3503 Goodhope St
- 3454 Nathaniel Brown St
- 3511 Seabrook St Unit A
- 3511 Seabrook St Unit C
- 3502 Goodhope St
- 3514 Goodhope St Unit B
- 3514 Goodhope St
- 3533 Lydia St
- 3510 Rebecca St
- 3555 Seabrook St
- 3557 Seabrook St
- 3535 Mount Pleasant St
- 3542 Mount Pleasant St
- 3524 Rebecca St
- 3544 Mount Pleasant St
- 3541 Mount Pleasant St
- 7613 Lady St
Your Personal Tour Guide
Ask me questions while you tour the home.