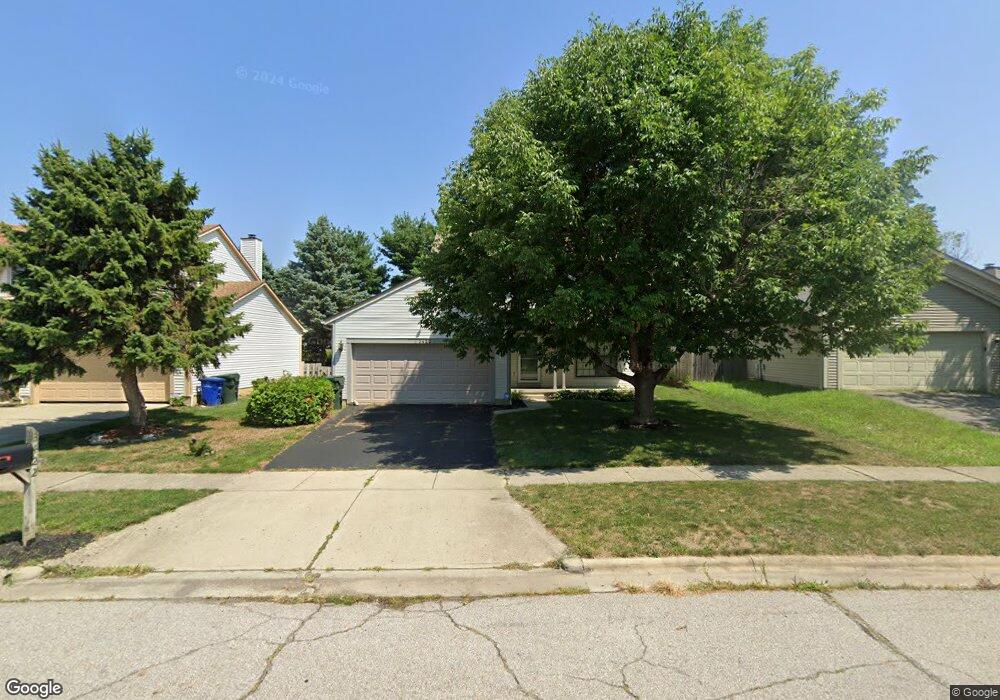
3422 Oak Bend Blvd Canal Winchester, OH 43110
Independence Village NeighborhoodEstimated Value: $287,000 - $299,000
3
Beds
3
Baths
1,570
Sq Ft
$186/Sq Ft
Est. Value
About This Home
This home is located at 3422 Oak Bend Blvd, Canal Winchester, OH 43110 and is currently estimated at $292,485, approximately $186 per square foot. 3422 Oak Bend Blvd is a home located in Franklin County with nearby schools including Groveport Madison High School, A+ Arts Academy, and Brice Christian Academy Elementary School.
Ownership History
Date
Name
Owned For
Owner Type
Purchase Details
Closed on
Dec 30, 2022
Sold by
Willis Danielle A
Bought by
Willis Danielle A
Current Estimated Value
Home Financials for this Owner
Home Financials are based on the most recent Mortgage that was taken out on this home.
Original Mortgage
$70,500
Interest Rate
6.33%
Mortgage Type
New Conventional
Purchase Details
Closed on
Dec 28, 2004
Sold by
William Fannin Builders Inc
Bought by
Blake Danielle A
Home Financials for this Owner
Home Financials are based on the most recent Mortgage that was taken out on this home.
Original Mortgage
$131,877
Interest Rate
5.9%
Mortgage Type
Purchase Money Mortgage
Purchase Details
Closed on
Oct 14, 2004
Sold by
Gates David A and Gates Sheyma P
Bought by
William Fannin Builders Inc
Purchase Details
Closed on
Nov 3, 1994
Sold by
Italia Homes Inc
Bought by
Gates David A and Gates Sheyma F
Home Financials for this Owner
Home Financials are based on the most recent Mortgage that was taken out on this home.
Original Mortgage
$112,168
Interest Rate
8.75%
Mortgage Type
FHA
Purchase Details
Closed on
Jan 26, 1994
Purchase Details
Closed on
Feb 14, 1992
Create a Home Valuation Report for This Property
The Home Valuation Report is an in-depth analysis detailing your home's value as well as a comparison with similar homes in the area
Home Values in the Area
Average Home Value in this Area
Purchase History
| Date | Buyer | Sale Price | Title Company |
|---|---|---|---|
| Willis Danielle A | -- | Visionet Systems | |
| Blake Danielle A | $131,900 | -- | |
| William Fannin Builders Inc | $119,500 | -- | |
| Gates David A | $113,240 | -- | |
| -- | $18,500 | -- | |
| -- | -- | -- |
Source: Public Records
Mortgage History
| Date | Status | Borrower | Loan Amount |
|---|---|---|---|
| Previous Owner | Willis Danielle A | $70,500 | |
| Previous Owner | Blake Danielle A | $131,877 | |
| Previous Owner | Gates David A | $112,168 |
Source: Public Records
Tax History Compared to Growth
Tax History
| Year | Tax Paid | Tax Assessment Tax Assessment Total Assessment is a certain percentage of the fair market value that is determined by local assessors to be the total taxable value of land and additions on the property. | Land | Improvement |
|---|---|---|---|---|
| 2024 | $3,721 | $87,750 | $22,230 | $65,520 |
| 2023 | $3,686 | $87,745 | $22,225 | $65,520 |
| 2022 | $2,579 | $51,070 | $8,400 | $42,670 |
| 2021 | $2,586 | $51,070 | $8,400 | $42,670 |
| 2020 | $2,591 | $51,070 | $8,400 | $42,670 |
| 2019 | $2,374 | $41,860 | $7,000 | $34,860 |
| 2018 | $2,392 | $41,860 | $7,000 | $34,860 |
| 2017 | $2,396 | $41,860 | $7,000 | $34,860 |
| 2016 | $2,368 | $37,810 | $8,510 | $29,300 |
| 2015 | $2,394 | $37,810 | $8,510 | $29,300 |
| 2014 | $2,421 | $37,810 | $8,510 | $29,300 |
| 2013 | $1,013 | $37,800 | $8,505 | $29,295 |
Source: Public Records
Map
Nearby Homes
- 3358 Cargin Ct
- 6800 Barker Dr
- 3292 Draycott Ct
- 3624 Peany Ln
- 3265 O'Heagra Dr
- 6926 Bennell Dr
- 3188 Creighton Place
- 3133 Earlington Ln
- 3124 Creighton Place
- 3072 Bocastle Ct
- 6747 Dorothys Crossing Unit 6747
- 7287 Candlestone Dr
- 6523 Dorothys Creek
- 3099 Ambarwent Rd
- 6775 Centennial Dr
- 7449 Sugarbark Ct
- 7490 Sugarbark Ct
- 6167 Kensington Glen Dr
- 3682 Winding Path Dr
- 6286 Stoney Glenn Ct
- 3428 Oak Bend Blvd
- 3416 Oak Bend Blvd
- 3408 Oak Bend Blvd
- 3367 Cargin Ct
- 6957 Kinston Dr
- 6949 Kinston Dr
- 3400 Oak Bend Blvd
- 3361 Cargin Ct
- 6941 Kinston Dr
- 3366 Cargin Ct
- 6800 Makady Rd
- 3437 Oak Bend Blvd
- 6933 Kinston Dr
- 3388 Oak Bend Blvd
- 3453 Oak Bend Blvd
- 3355 Cargin Ct
- 3395 Oak Bend Blvd
- 3376 Oak Bend Blvd
- 6917 Kinston Dr