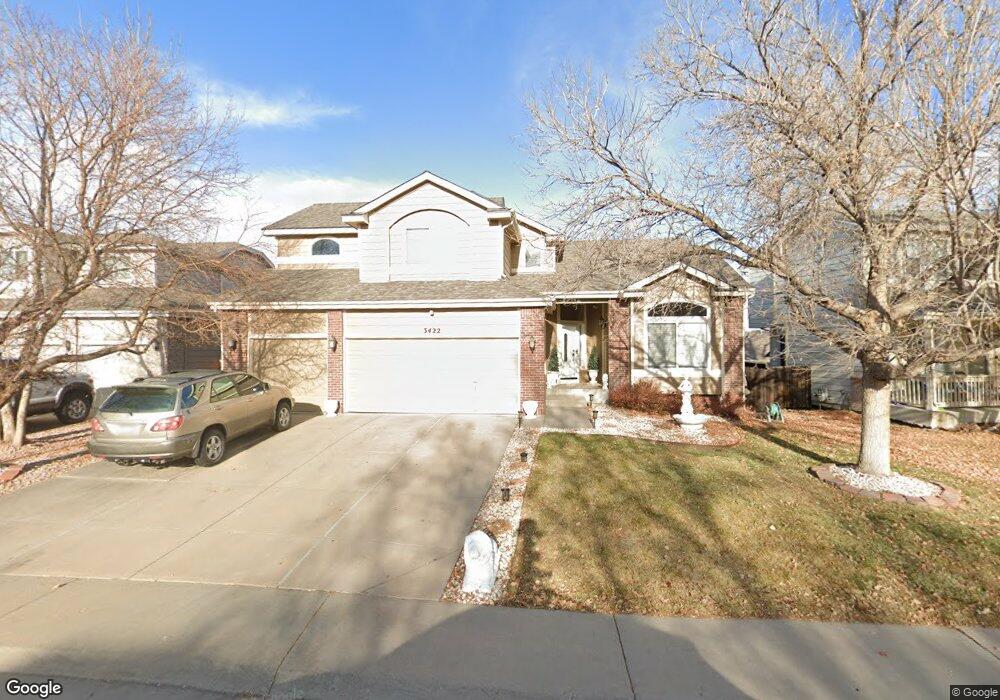
3422 S Flanders Way Aurora, CO 80013
Seven Hills NeighborhoodEstimated Value: $533,145 - $623,000
4
Beds
3
Baths
3,088
Sq Ft
$182/Sq Ft
Est. Value
About This Home
This home is located at 3422 S Flanders Way, Aurora, CO 80013 and is currently estimated at $563,036, approximately $182 per square foot. 3422 S Flanders Way is a home located in Arapahoe County with nearby schools including Arrowhead Elementary School, Horizon Middle School, and Smoky Hill High School.
Ownership History
Date
Name
Owned For
Owner Type
Purchase Details
Closed on
May 29, 2013
Sold by
Pritchard Truha T and Nguyen Sean T
Bought by
Pritchard Thuha T
Current Estimated Value
Purchase Details
Closed on
Oct 1, 2011
Sold by
Nguyen Si T
Bought by
Pritchard Thuha T and Nguyen Sean T
Purchase Details
Closed on
Dec 18, 2009
Sold by
The Secretary Of Veterans Affairs
Bought by
Nguyen Si T
Purchase Details
Closed on
Aug 14, 2009
Sold by
Cullum Warren Keith and Cullum Debora J
Bought by
Wells Fargo Bank Na
Purchase Details
Closed on
Aug 10, 2000
Sold by
Cullum Warren Keith and Cullum Debora J
Bought by
Cullum Deborah J
Purchase Details
Closed on
Jul 18, 1997
Sold by
Cameo Homes Inc
Bought by
Cullum Warren Keith and Cullum Debora J
Home Financials for this Owner
Home Financials are based on the most recent Mortgage that was taken out on this home.
Original Mortgage
$191,709
Interest Rate
7.72%
Mortgage Type
VA
Create a Home Valuation Report for This Property
The Home Valuation Report is an in-depth analysis detailing your home's value as well as a comparison with similar homes in the area
Home Values in the Area
Average Home Value in this Area
Purchase History
| Date | Buyer | Sale Price | Title Company |
|---|---|---|---|
| Pritchard Thuha T | -- | None Available | |
| Pritchard Thuha T | -- | None Available | |
| Nguyen Si T | $200,000 | None Available | |
| Wells Fargo Bank Na | -- | None Available | |
| Cullum Deborah J | -- | -- | |
| Cullum Warren Keith | $188,340 | Land Title |
Source: Public Records
Mortgage History
| Date | Status | Borrower | Loan Amount |
|---|---|---|---|
| Previous Owner | Cullum Warren Keith | $191,709 |
Source: Public Records
Tax History Compared to Growth
Tax History
| Year | Tax Paid | Tax Assessment Tax Assessment Total Assessment is a certain percentage of the fair market value that is determined by local assessors to be the total taxable value of land and additions on the property. | Land | Improvement |
|---|---|---|---|---|
| 2024 | $2,440 | $35,276 | -- | -- |
| 2023 | $2,440 | $35,276 | $0 | $0 |
| 2022 | $2,136 | $29,496 | $0 | $0 |
| 2021 | $2,150 | $29,496 | $0 | $0 |
| 2020 | $2,030 | $28,272 | $0 | $0 |
| 2019 | $1,959 | $28,272 | $0 | $0 |
| 2018 | $1,849 | $25,085 | $0 | $0 |
| 2017 | $1,823 | $25,085 | $0 | $0 |
| 2016 | $1,754 | $22,630 | $0 | $0 |
| 2015 | $1,669 | $22,630 | $0 | $0 |
| 2014 | $1,433 | $17,217 | $0 | $0 |
| 2013 | -- | $18,060 | $0 | $0 |
Source: Public Records
Map
Nearby Homes
- 3517 S Fundy Ct
- 3247 S Ensenada Way
- 19830 E Eldorado Dr
- 3528 S Fundy Ct
- 3617 S Fundy Way
- 19398 E Eastman Place
- 3226 S Danube St
- 19659 E Dartmouth Place
- 19038 E Hampden Dr
- 3681 S Flanders St
- 19801 E Dartmouth Ave
- 3385 S Jericho Ct
- 20148 E Dartmouth Dr
- 3051 S Espana Way
- 3136 S Cathay Cir
- 3702 S Halifax St
- 19660 E Loyola Cir
- 3815 S Genoa Cir Unit C
- 3796 S Ceylon Way
- 3782 S Genoa Cir Unit A
- 3412 S Flanders Way
- 3432 S Flanders Way
- 19604 E Girard Ave
- 19654 E Girard Dr
- 19674 E Girard Dr
- 3421 S Flanders Way
- 3431 S Flanders Way
- 19614 E Girard Dr
- 3411 S Flanders Way
- 19591 E Girton Place
- 19684 E Girard Dr
- 3441 S Flanders Way
- 19694 E Girard Dr
- 19550 E Greenwood Place
- 3440 S Espana Ct
- 3451 S Flanders Way
- 19631 E Girard Ave
- 19581 E Girton Place
- 19643 E Girard Dr
- 19572 E Girton Place